
Sources and assumptions
Nigeria
Disclaimer
This dashboard is for information only and is not investment, financial, legal or regulatory advice. Figures reflect sources available on 10 October 2026. DERCA accepts no liability for decisions based on it. Corrections are welcome: suggest a correction.
Data as of 10 October 2026 · version 2026-10-11.
Assumptions and notes
- N1Solar figures are Ember estimates of all solar added in each year (utility-scale, distributed and off-grid together), not distributed solar alone. Ember derives them from Chinese panel export data, assuming 73% of exports are installed about six months after export, adjusted for imports from other countries, re-exports, domestic manufacturing and, where available, official data.
- N22026 values are Ember's estimate for the full year. Small-market estimates are uncertain and can swing sharply from year to year.
- N3Access rates are World Bank 2024 data (database updated 8 October 2026). People without electricity is a DERCA calculation: (100% − access rate) × 2024 population. It may differ slightly from Tracking SDG7 figures.
- N4Firm outages: share of firms reporting electrical outages in the World Bank Enterprise Survey. Survey years differ by country and are shown with each value.
- N5Rules reflect a desk review of public sources to 10 October 2026. “None found” means DERCA could not locate a rule in the sources reviewed, not that none exists. Countries reviewed in detail in the full report are marked; others received a shorter scan, with confidence shown per field.
- N6CrossBoundary Energy regulatory stages (January 2024, Namibia updated August 2025) are shown only where CrossBoundary assigned one.
- N7DERCA does not rank countries. Data are provided for information only, and DERCA accepts no liability for decisions based on them. Corrections are welcome and will be logged.
“None found” means we could not locate a rule in public sources reviewed to 10 October 2026, not that one cannot exist.
Sources
- 1Ember (2026). Solar additions by country, Africa, 2023–2026 (MW). Country dataset accompanying "The take-off in African solar that official statistics can't yet see", 26 August 2026. Licence: CC BY-SA 4.0. · Dataset
- 2World Bank, World Development Indicators via API: EG.ELC.ACCS.ZS, EG.ELC.ACCS.RU.ZS, EG.ELC.ACCS.UR.ZS, SP.POP.TOTL (2024 data; database last updated 8 October 2026; retrieved 10 October 2026). · Dataset
- 3World Bank Enterprise Surveys, indicator IC.ELC.OUTG.ZS: firms experiencing electrical outages (% of firms), latest survey year per country (via WDI API, updated 8 October 2026; retrieved 10 October 2026). · Dataset
- 4World Bank (2025). Defying Outages: The Struggles and Strategies of Businesses Facing Unreliable Electricity. Global Indicators Brief No. 32, 11 June 2025; World Bank Enterprise Surveys indicator IC.ELC.OUTG.ZS (accessed 10 October 2026). · Cited in the report
- 5Ember (2025). Africa's solar imports surge 60%, giving the first evidence of a take-off in solar in Africa. 26 August 2025. ember-energy.org. · Cited in the report
- 6Ember (2026). The take-off in African solar that official statistics can't yet see. 26 August 2026. ember-energy.org. Licence: CC BY-SA 4.0. · Cited in the report
- 7GOGLA (2026). Global Off-Grid Solar Market Report 2026 (sales data for 2025). June 2026. · Cited in the report
- 8Intelpoint (2024). Nigeria's national grid has collapsed 12 times in 2024. · Cited in the report
- 9Techeconomy (2026), citing NERC factsheet: national metering rate 57.27% (December 2025). · Cited in the report
- 10Mondaq (2026). Key regulatory update: NERC Mini-Grid Regulations 2026. · Cited in the report
- 11NERC Net Billing Regulations 2026 (issued 3 June 2026), as summarised by Templars (10 June 2026) and DLA Piper Africa (2026). · Cited in the report
- 12NERC (2026). 15 States have transitioned to regulating their state electricity markets. 4 May 2026. · Cited in the report
- 13IEA, IRENA, UNSD, World Bank, WHO (2026). Tracking SDG7: The Energy Progress Report 2026. SEforALL, July 2026. · Cited in the report
- 14World Bank, World Development Indicators: Access to electricity (% of population), EG.ELC.ACCS.ZS, 2024 data (updated 8 October 2026). · Cited in the report
Ember data © Ember, licensed CC BY-SA 4.0. The full report lists all 86 sources.
Photo credits
All photographs show real people and places in Africa. None is stock or AI-generated. CC BY-SA images are shown cropped.
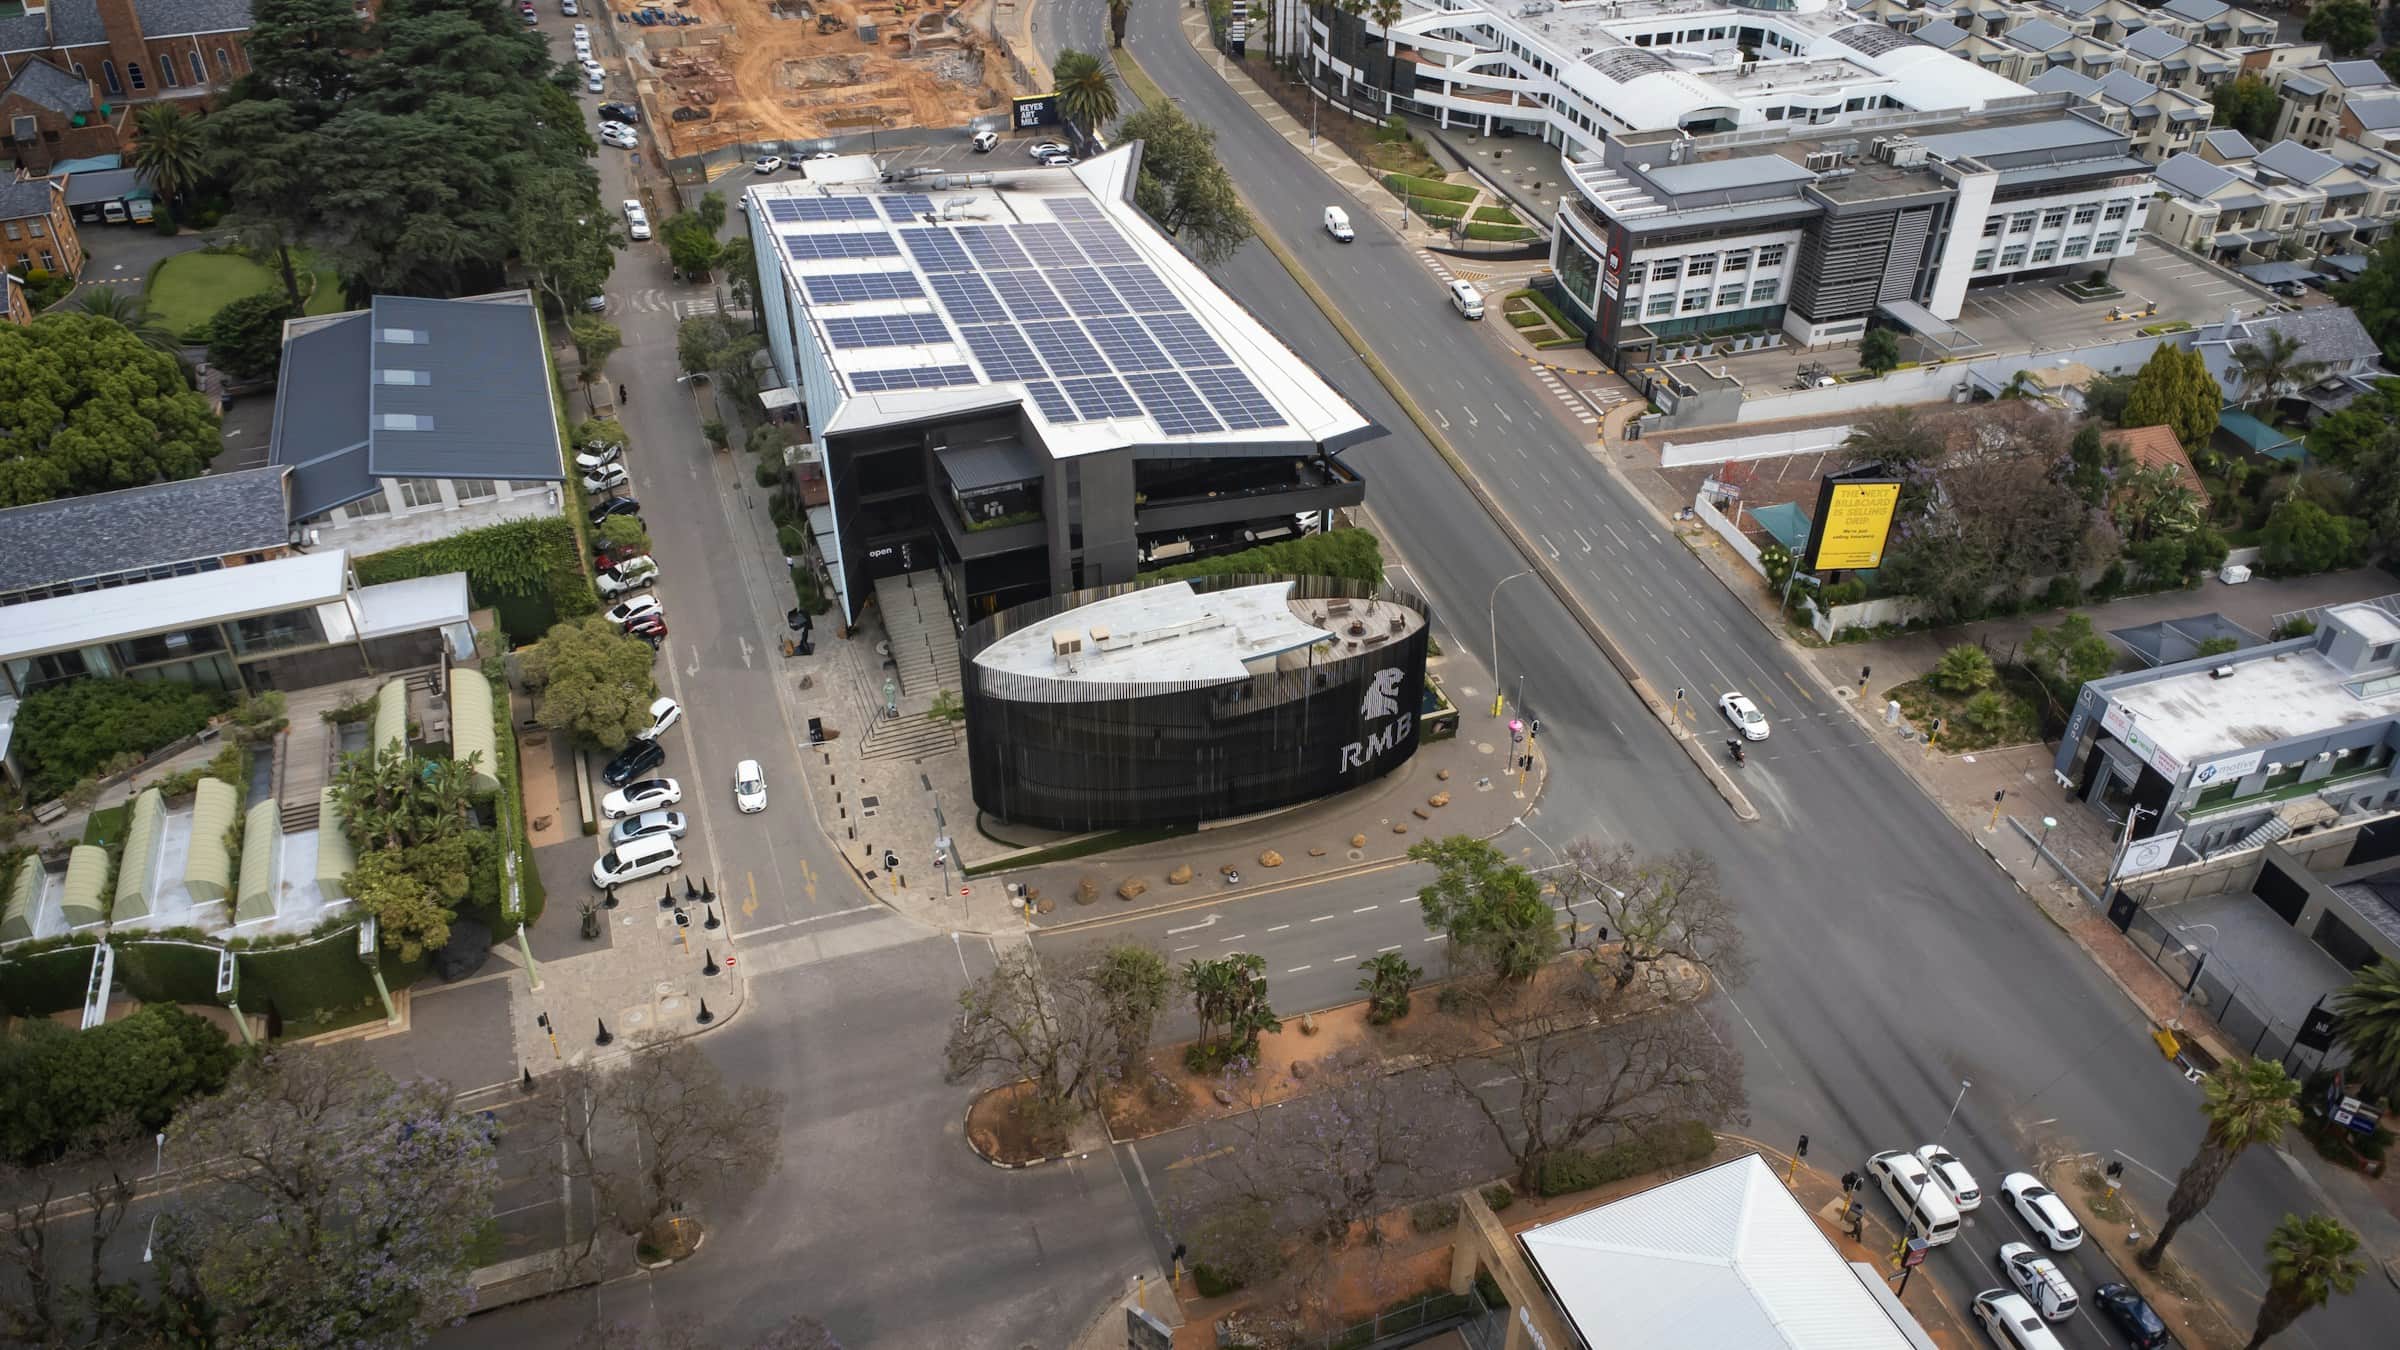 Commercial rooftop solar, Rosebank, Johannesburg, South AfricaJolame Chirwa / Unsplash · Unsplash Licence · Source
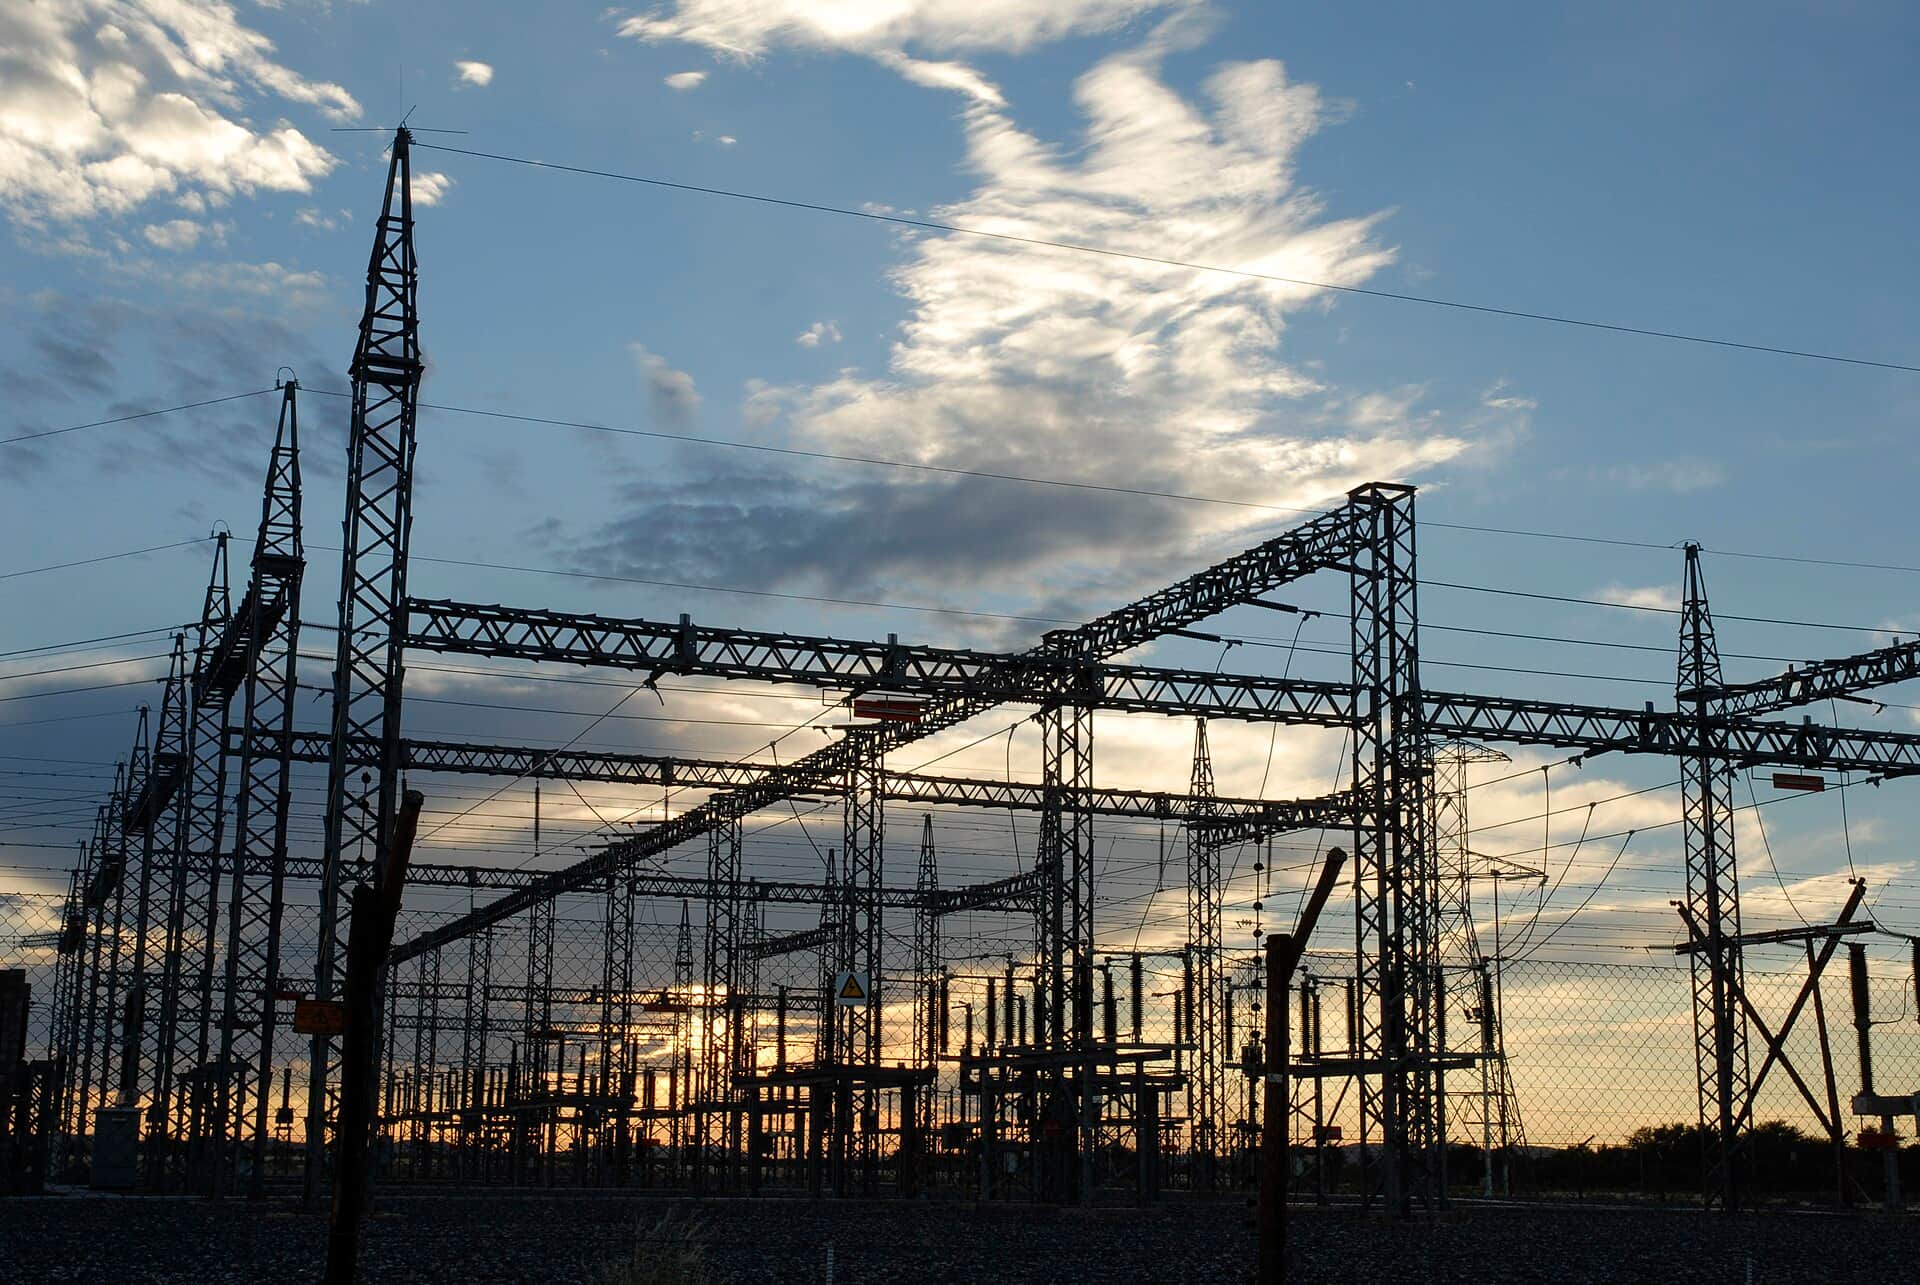 Gordonia substation, Upington, South AfricaGraeme Williams, Media Club / Wikimedia Commons · CC BY-SA 2.0, cropped · Source
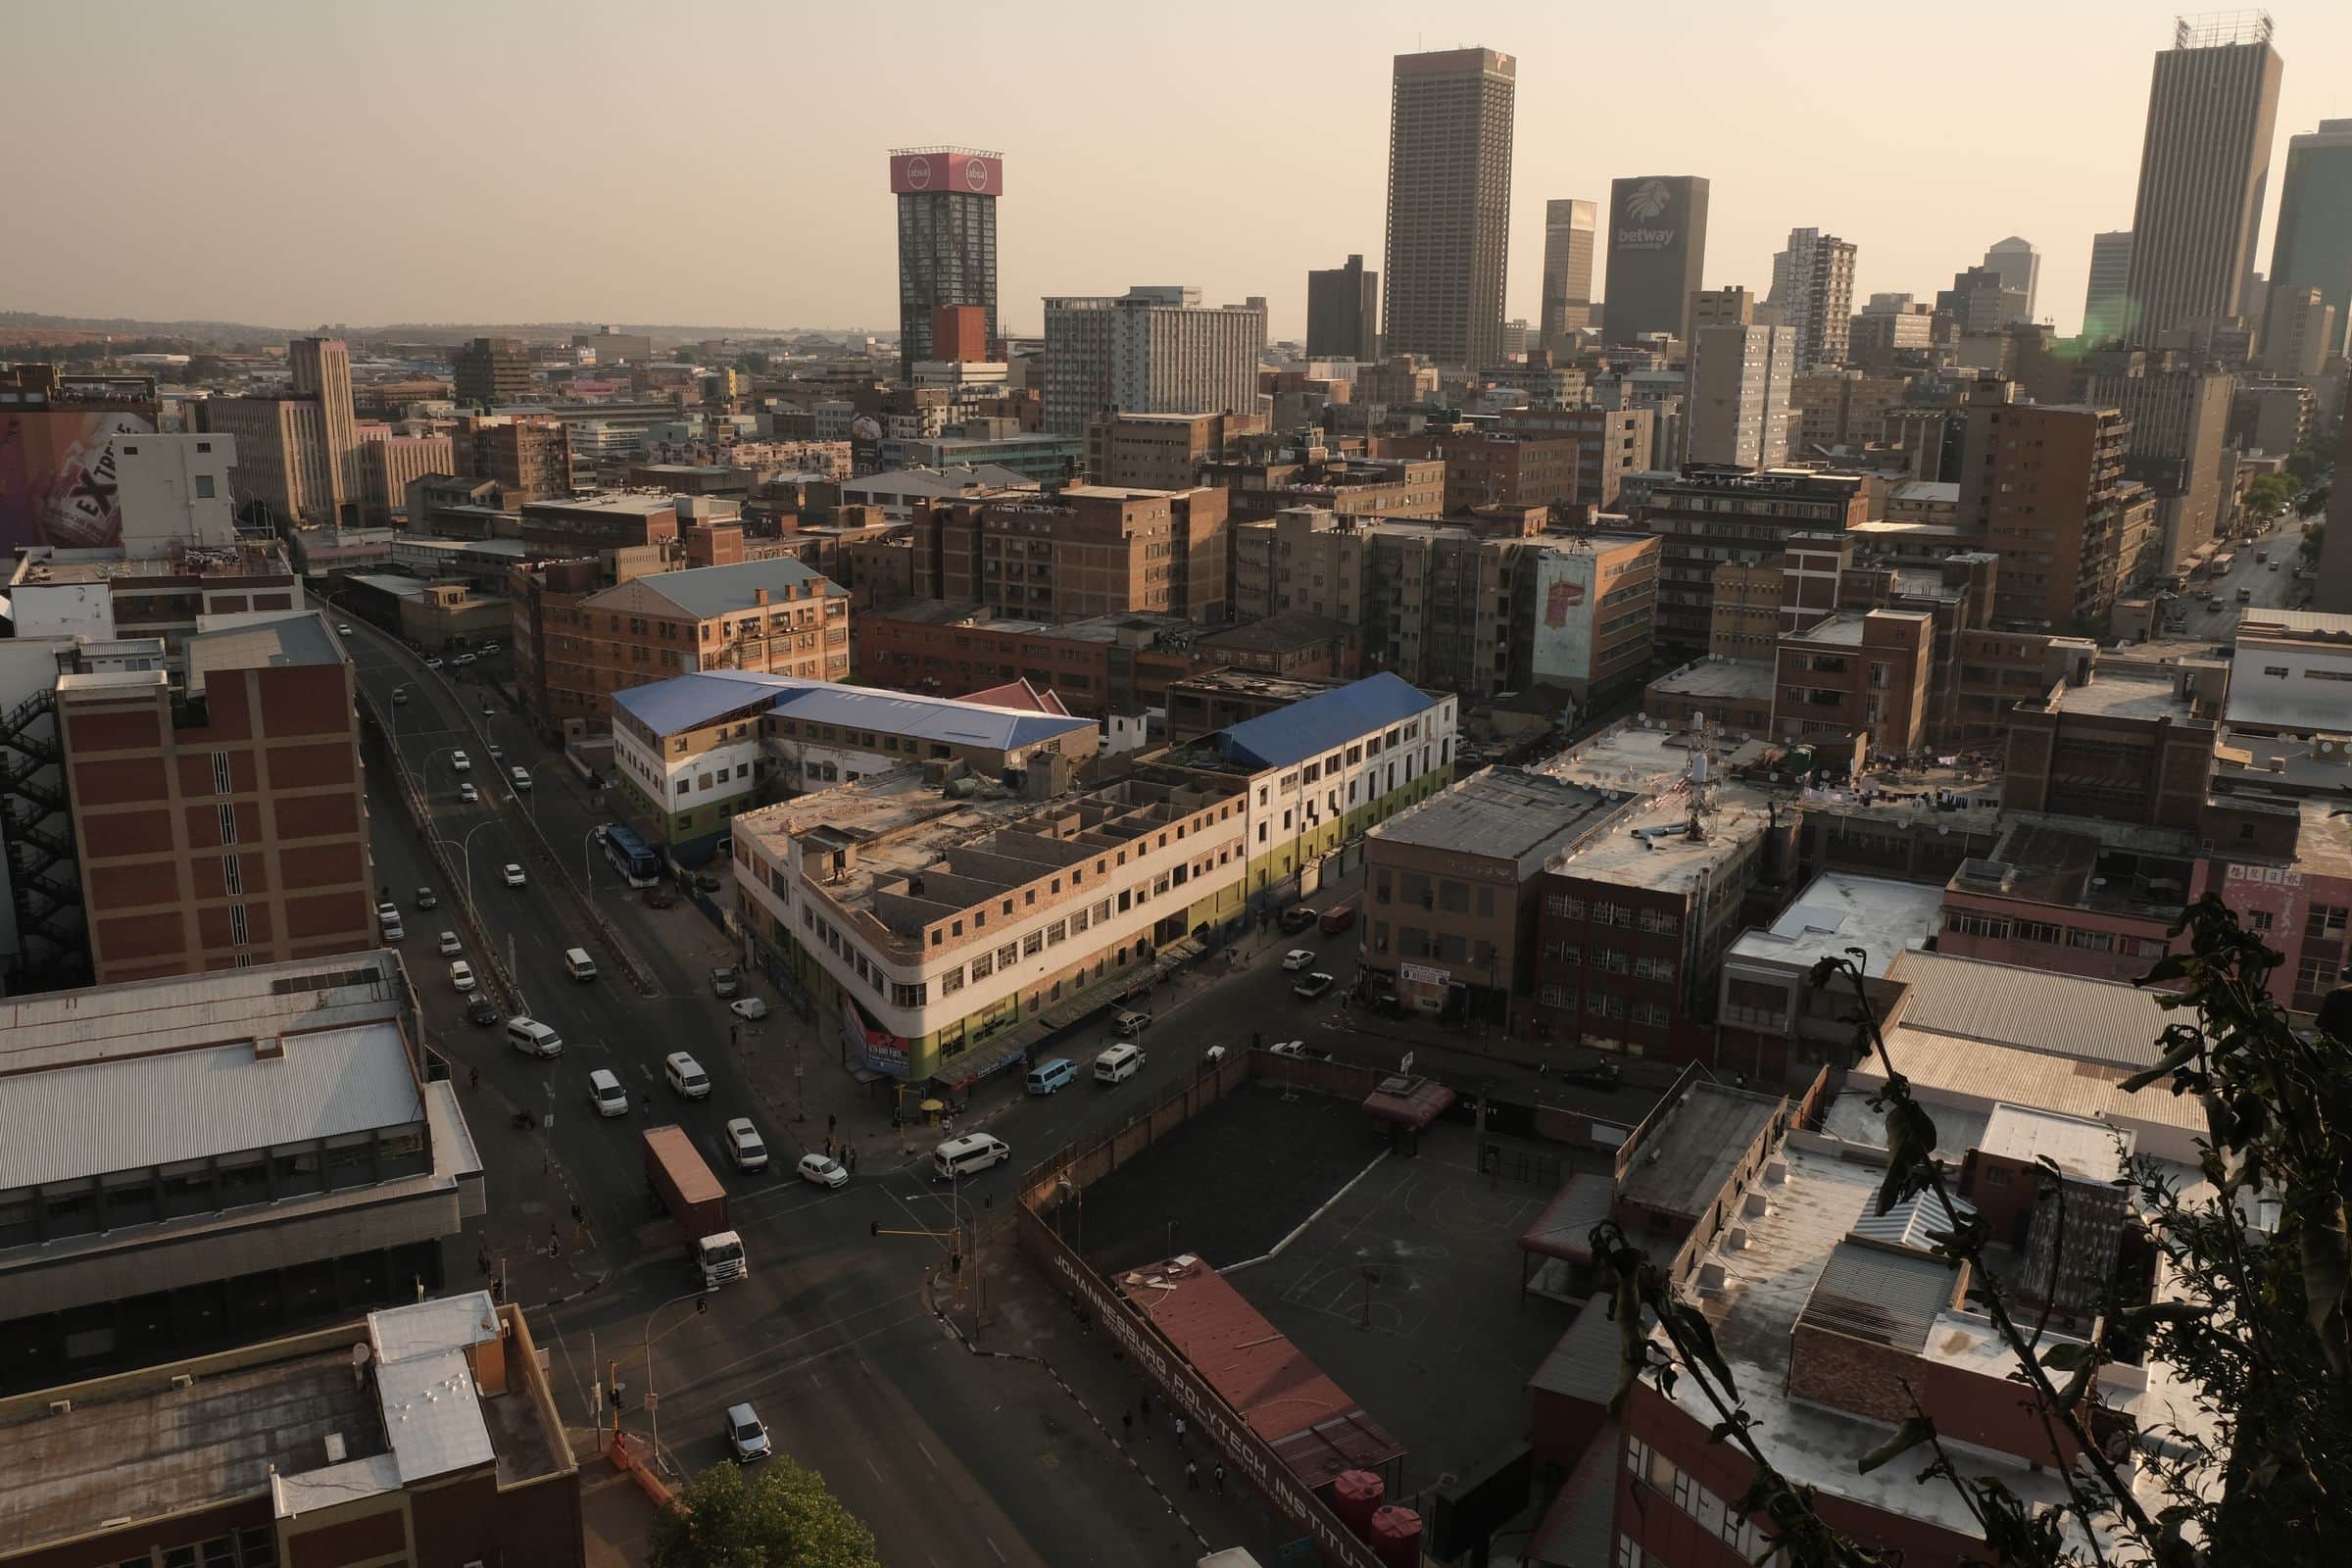 Johannesburg at duskJoshua Bull / Pexels · Pexels Licence · Source
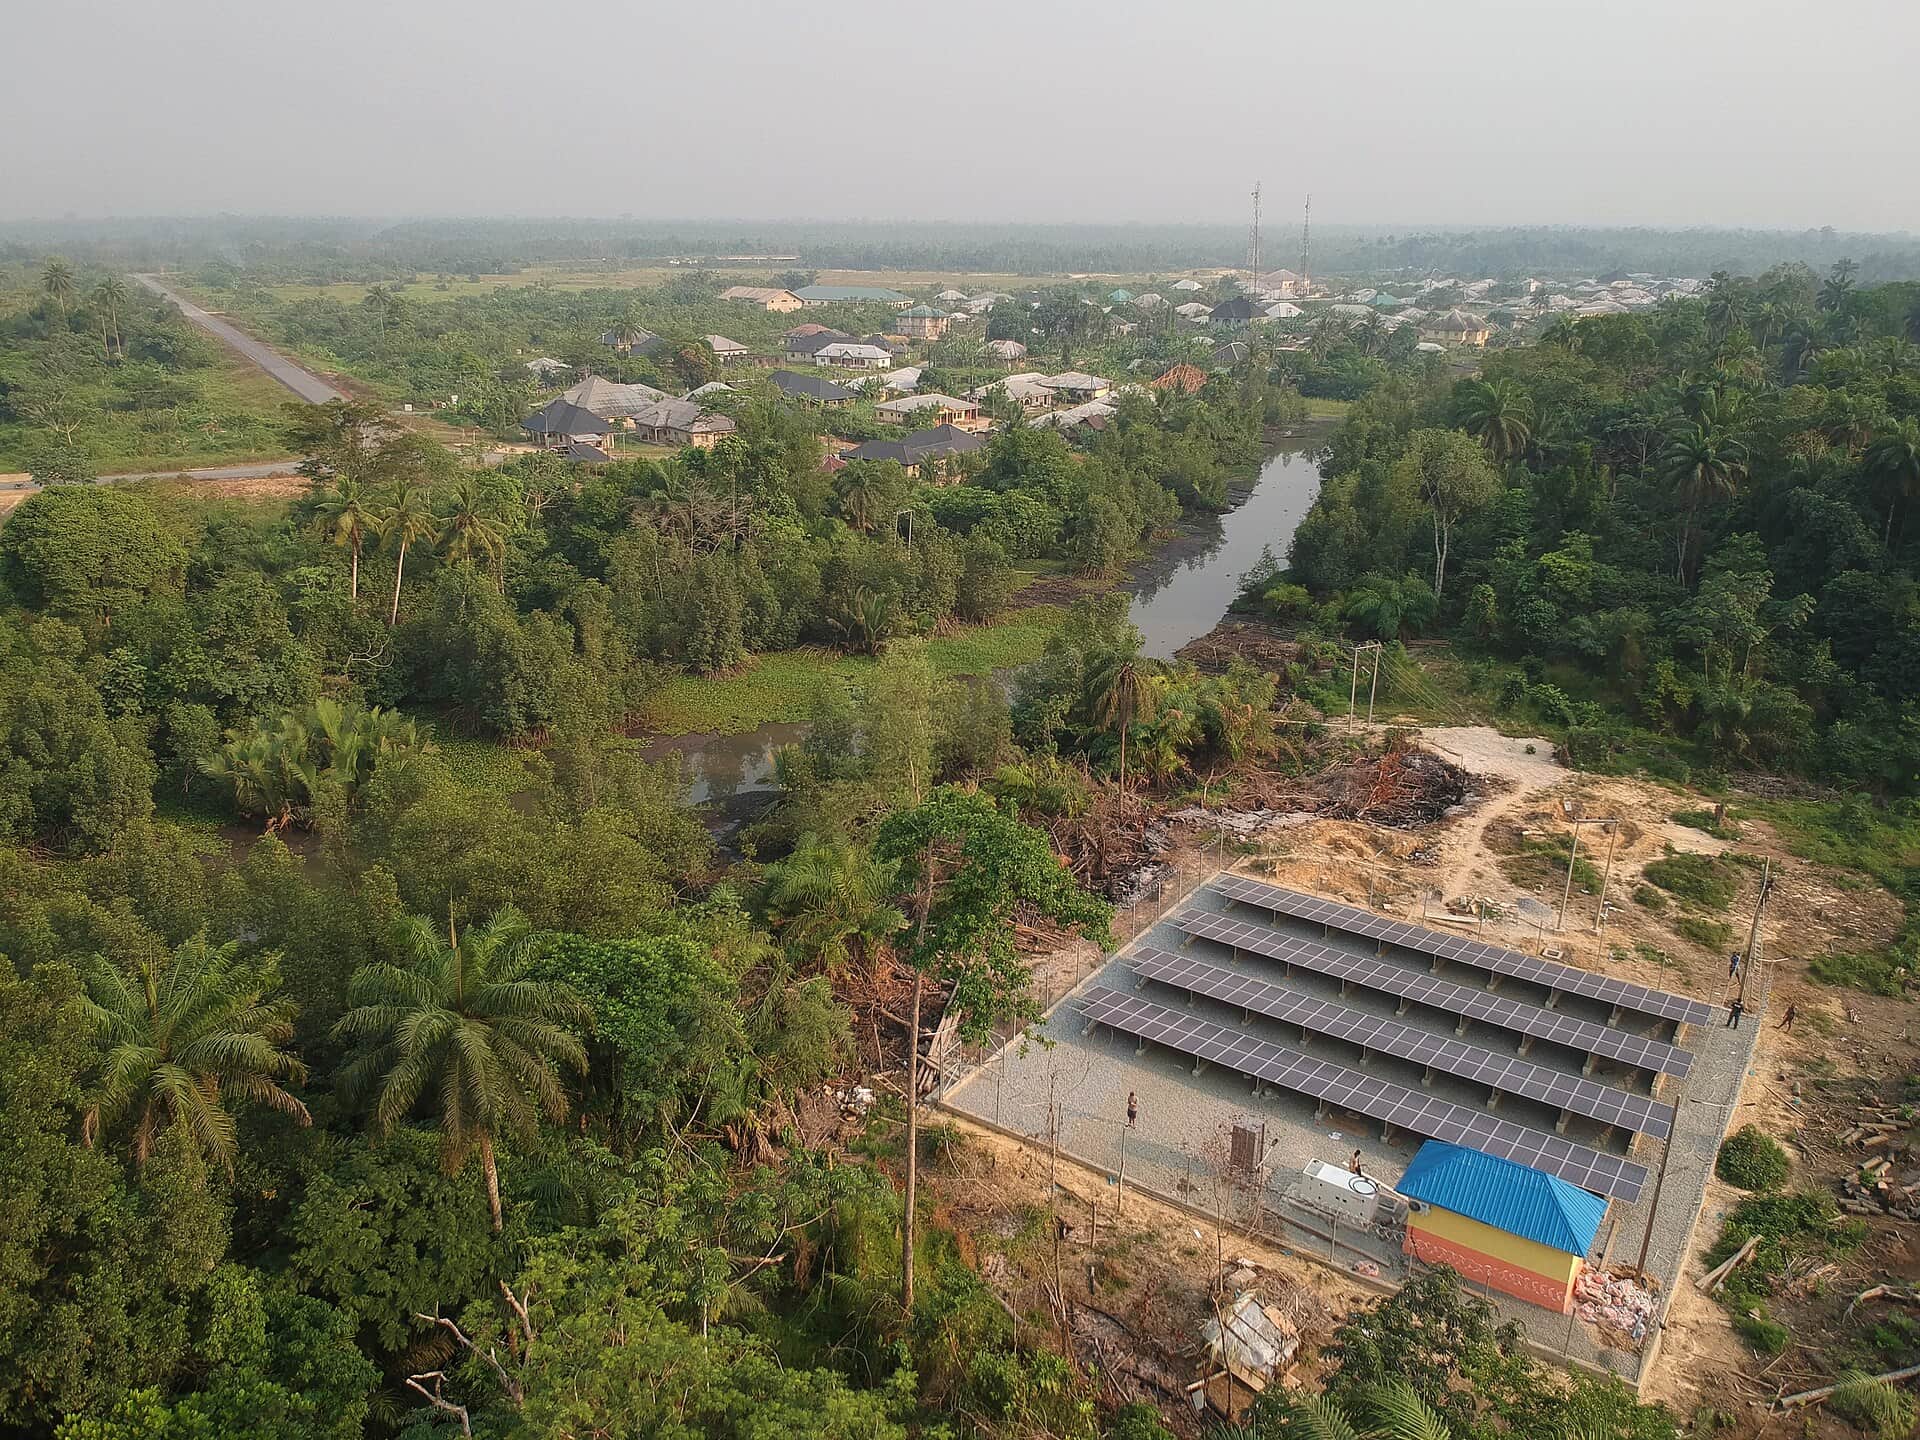 Solar mini-grid, Bayelsa State, NigeriaRupumped / Wikimedia Commons · CC BY-SA 4.0, cropped · Source
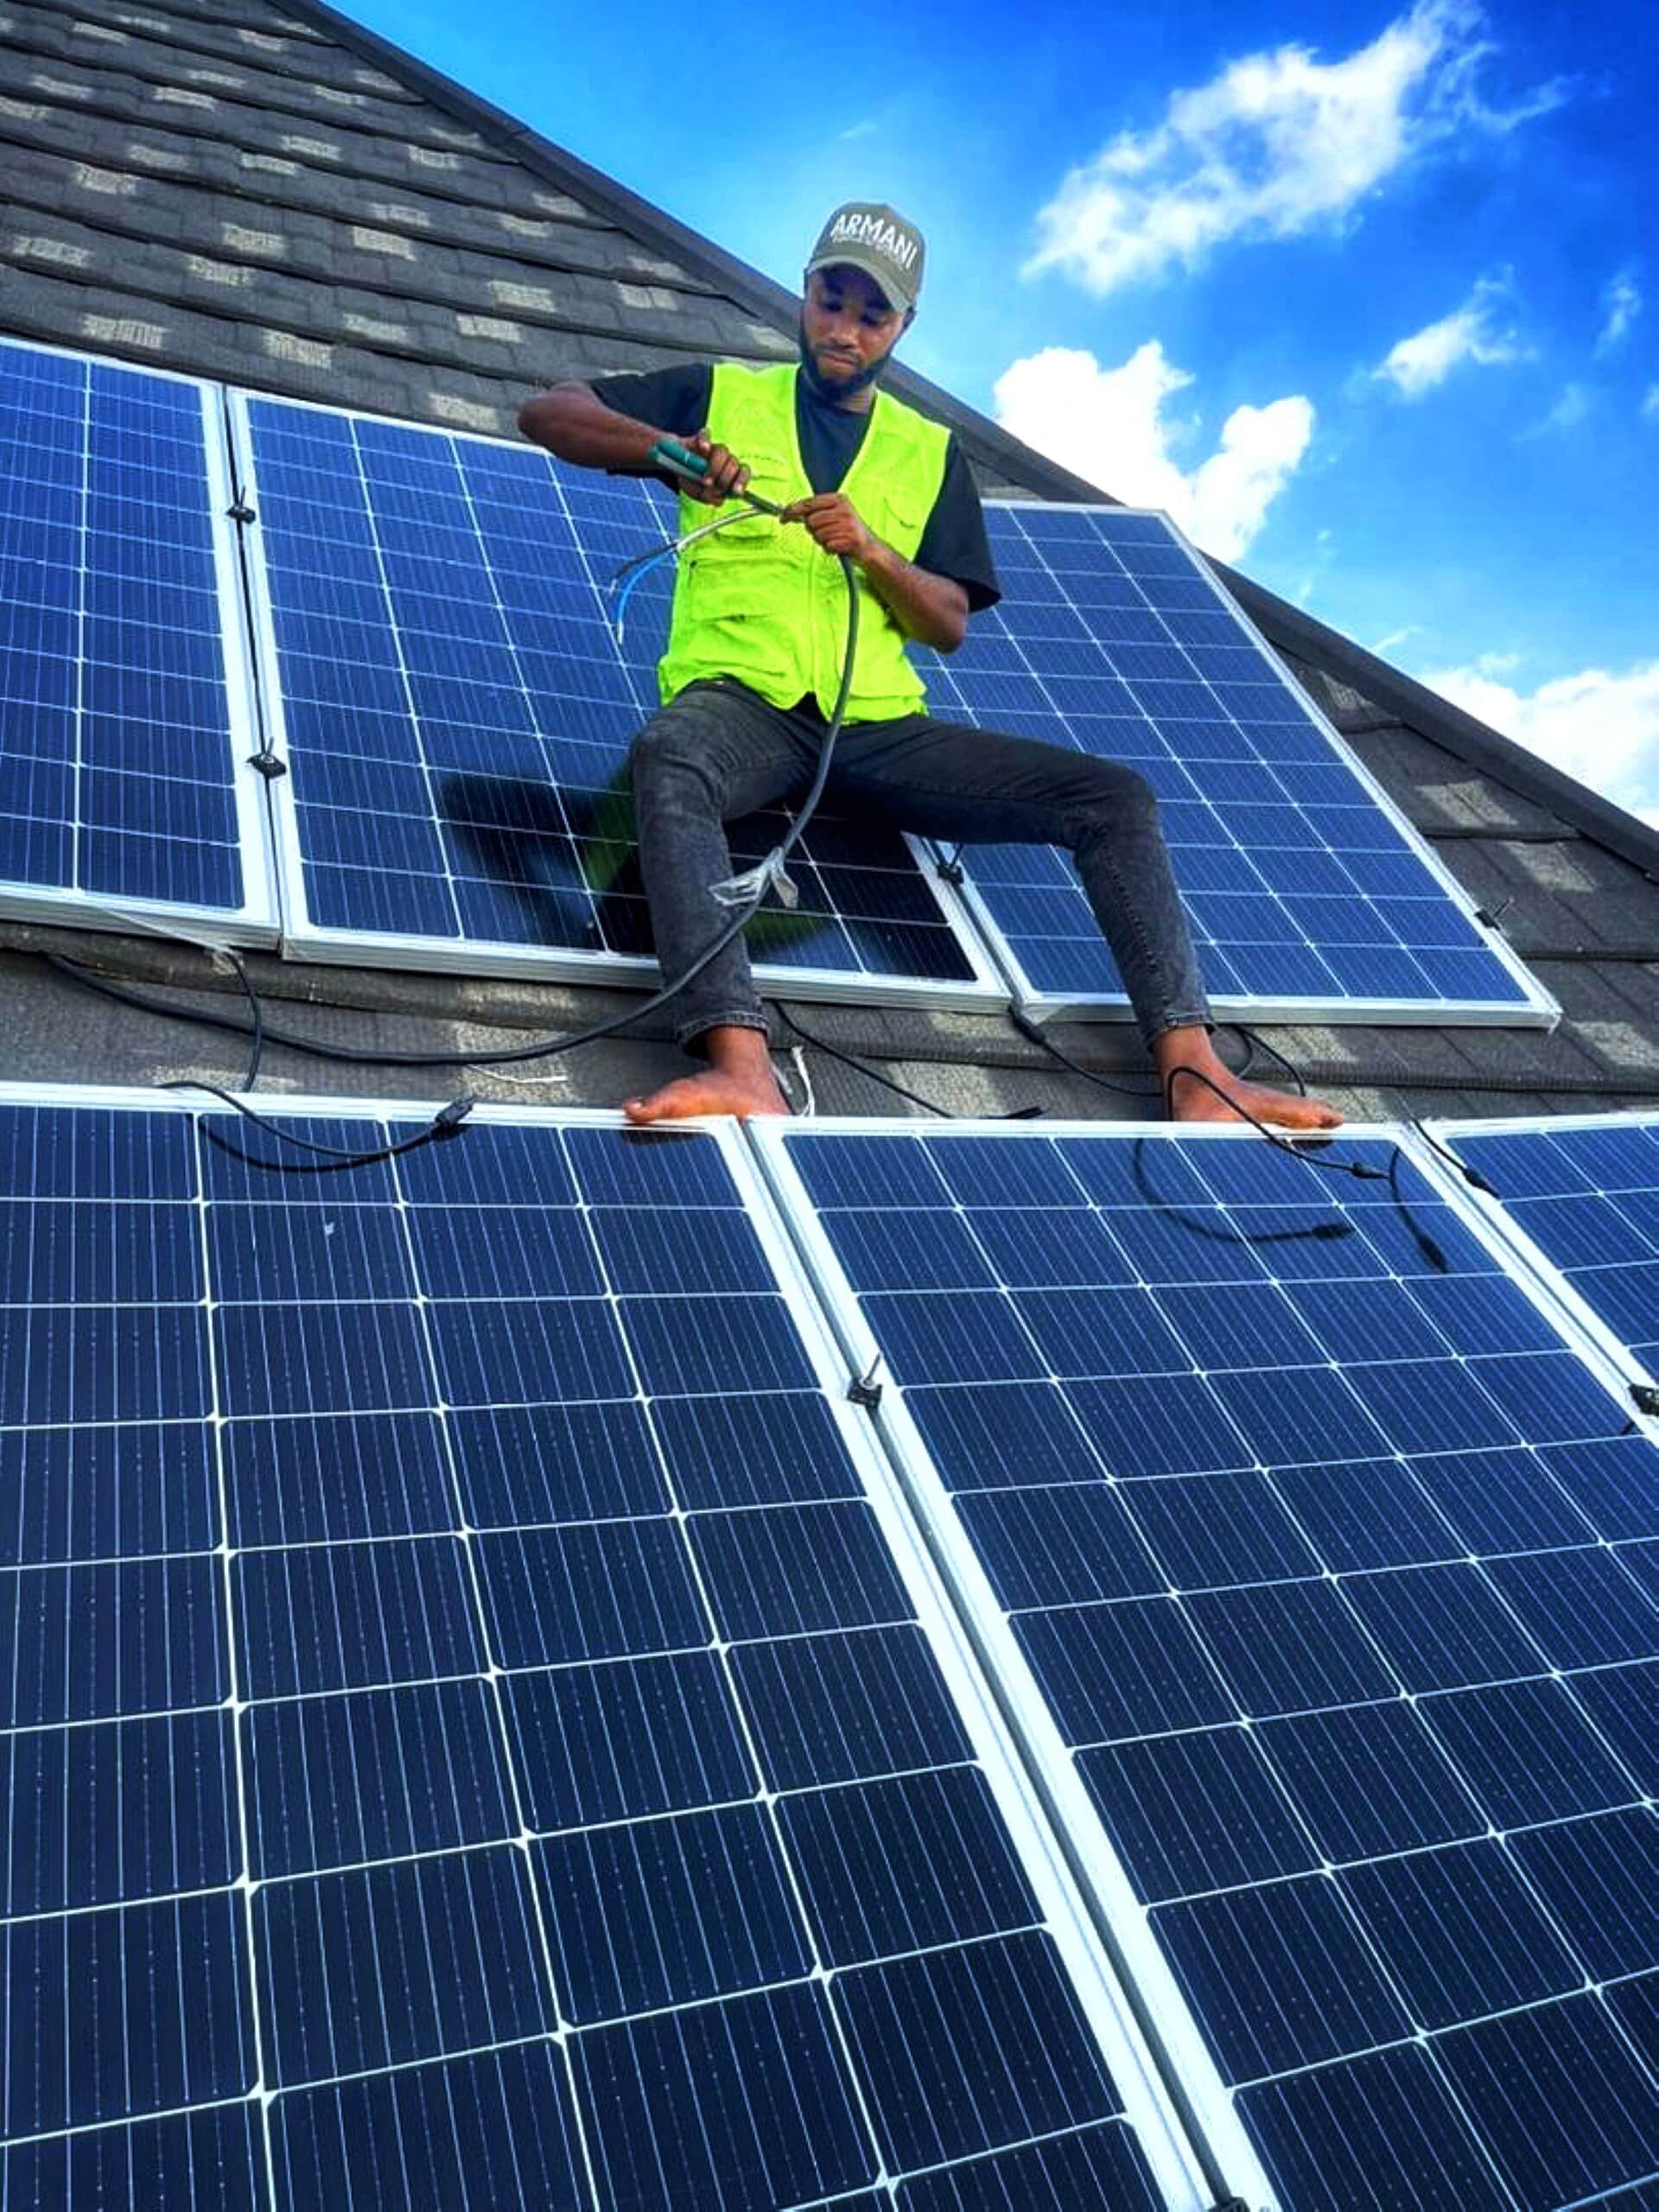 Installer on residential rooftop, NigeriaBenjamin Blessing / Wikimedia Commons · CC BY-SA 4.0, cropped · Source
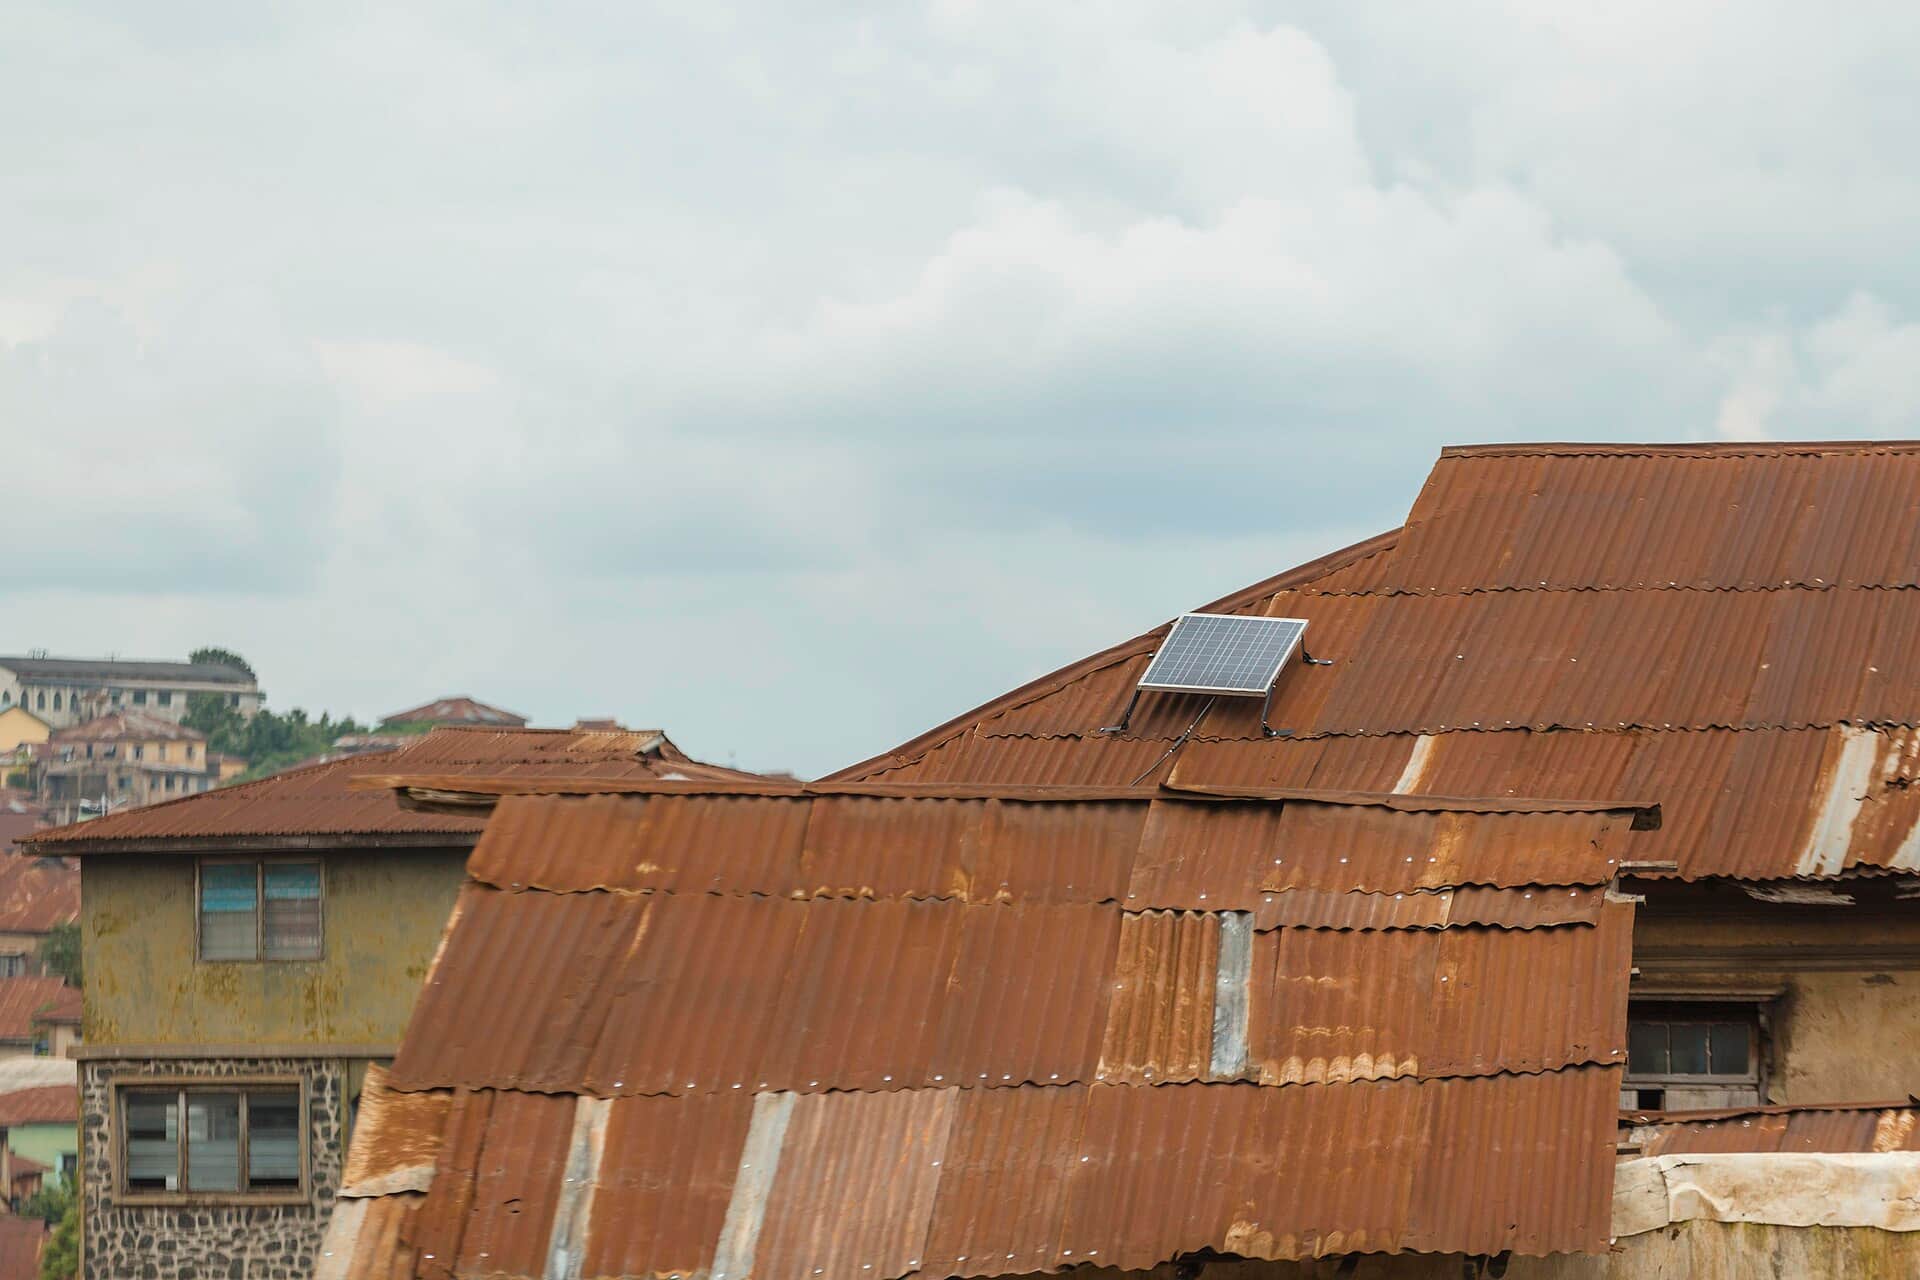 Rooftop solar, Abeokuta, Ogun State, NigeriaS.aderogba / Wikimedia Commons · CC BY-SA 4.0, cropped · Source
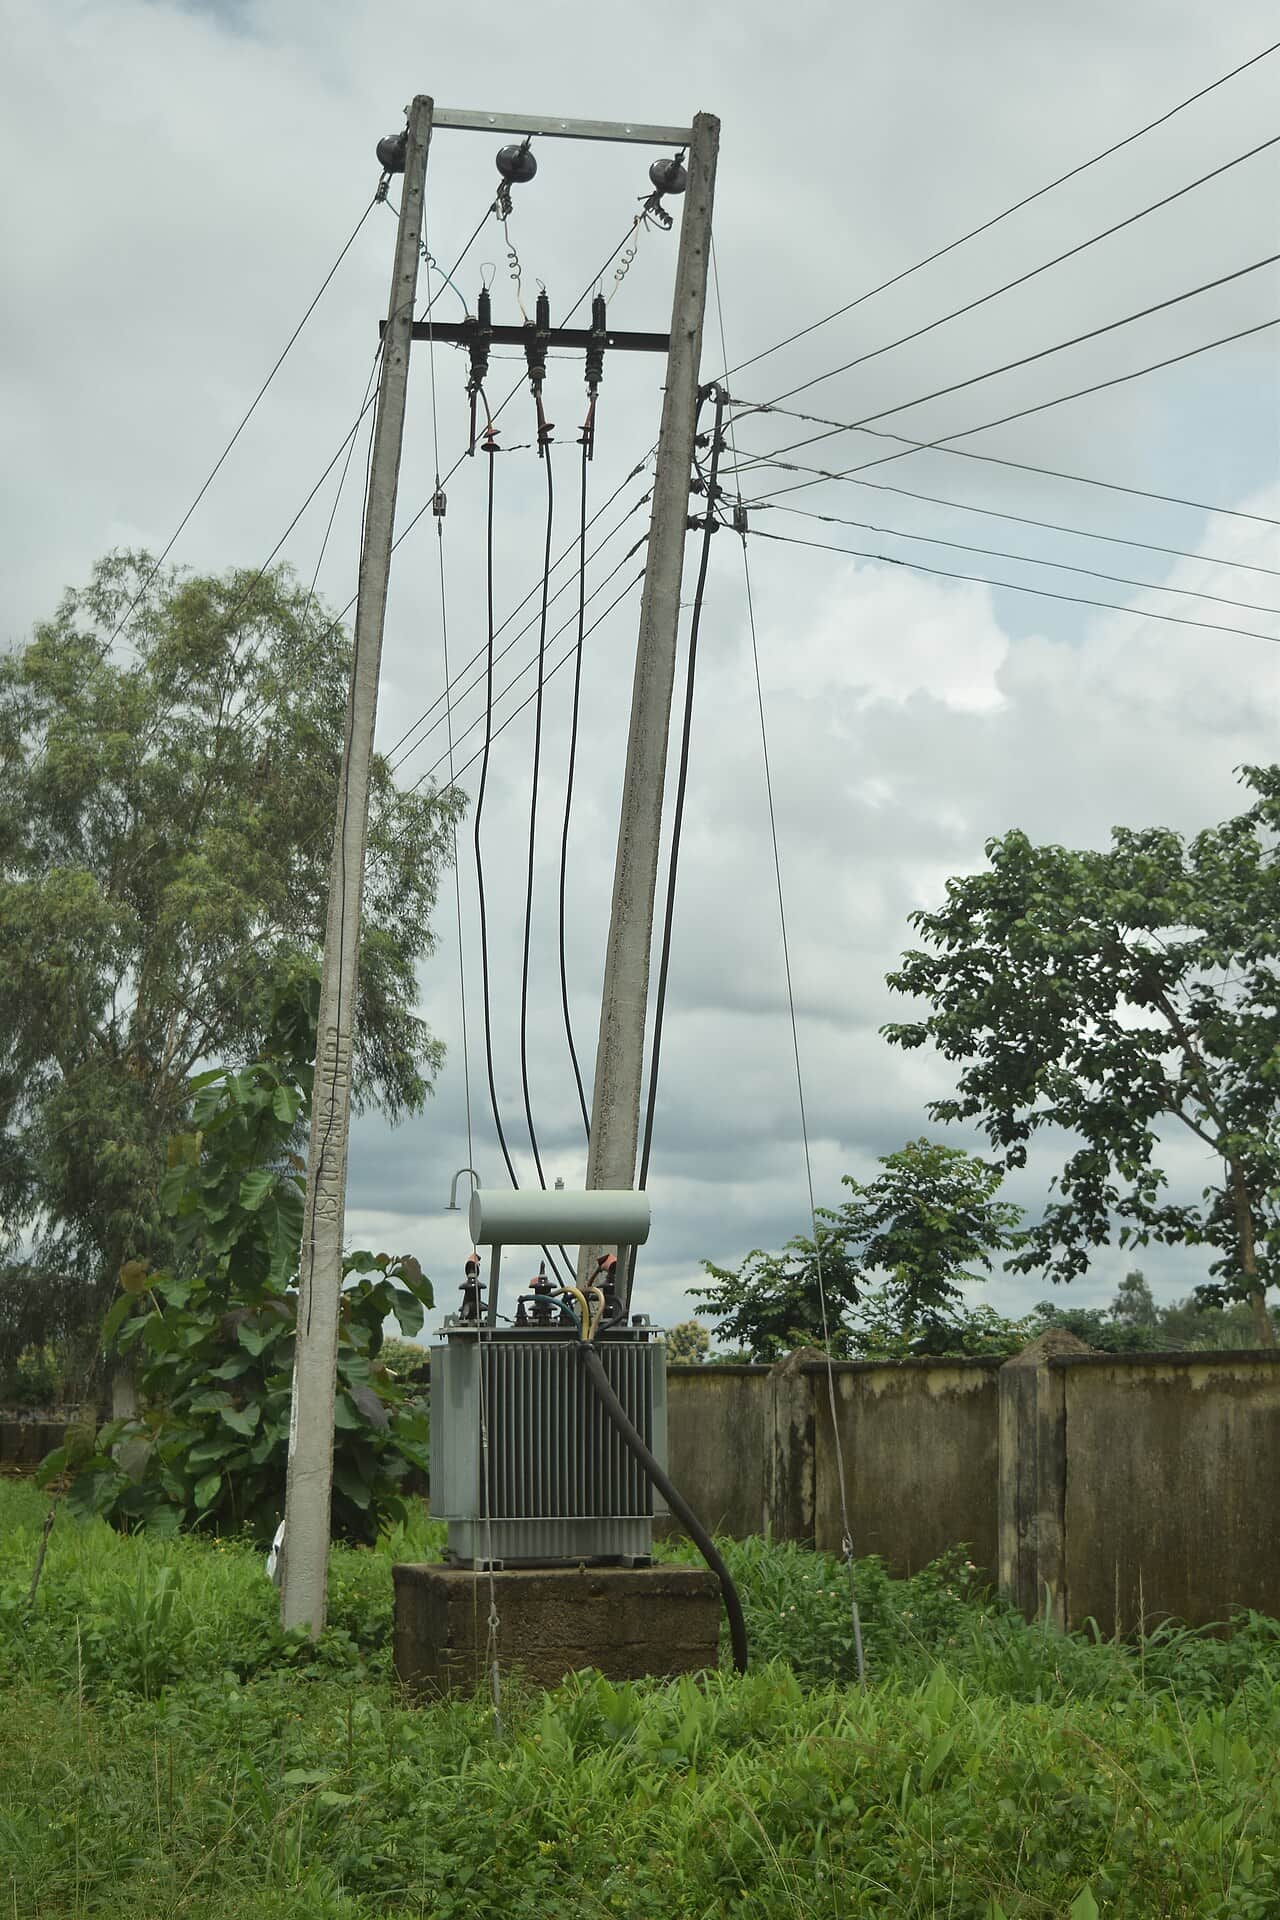 Distribution transformer, Kafanchan, Kaduna State, NigeriaKambai Akau / Wikimedia Commons · CC BY-SA 4.0, cropped · Source
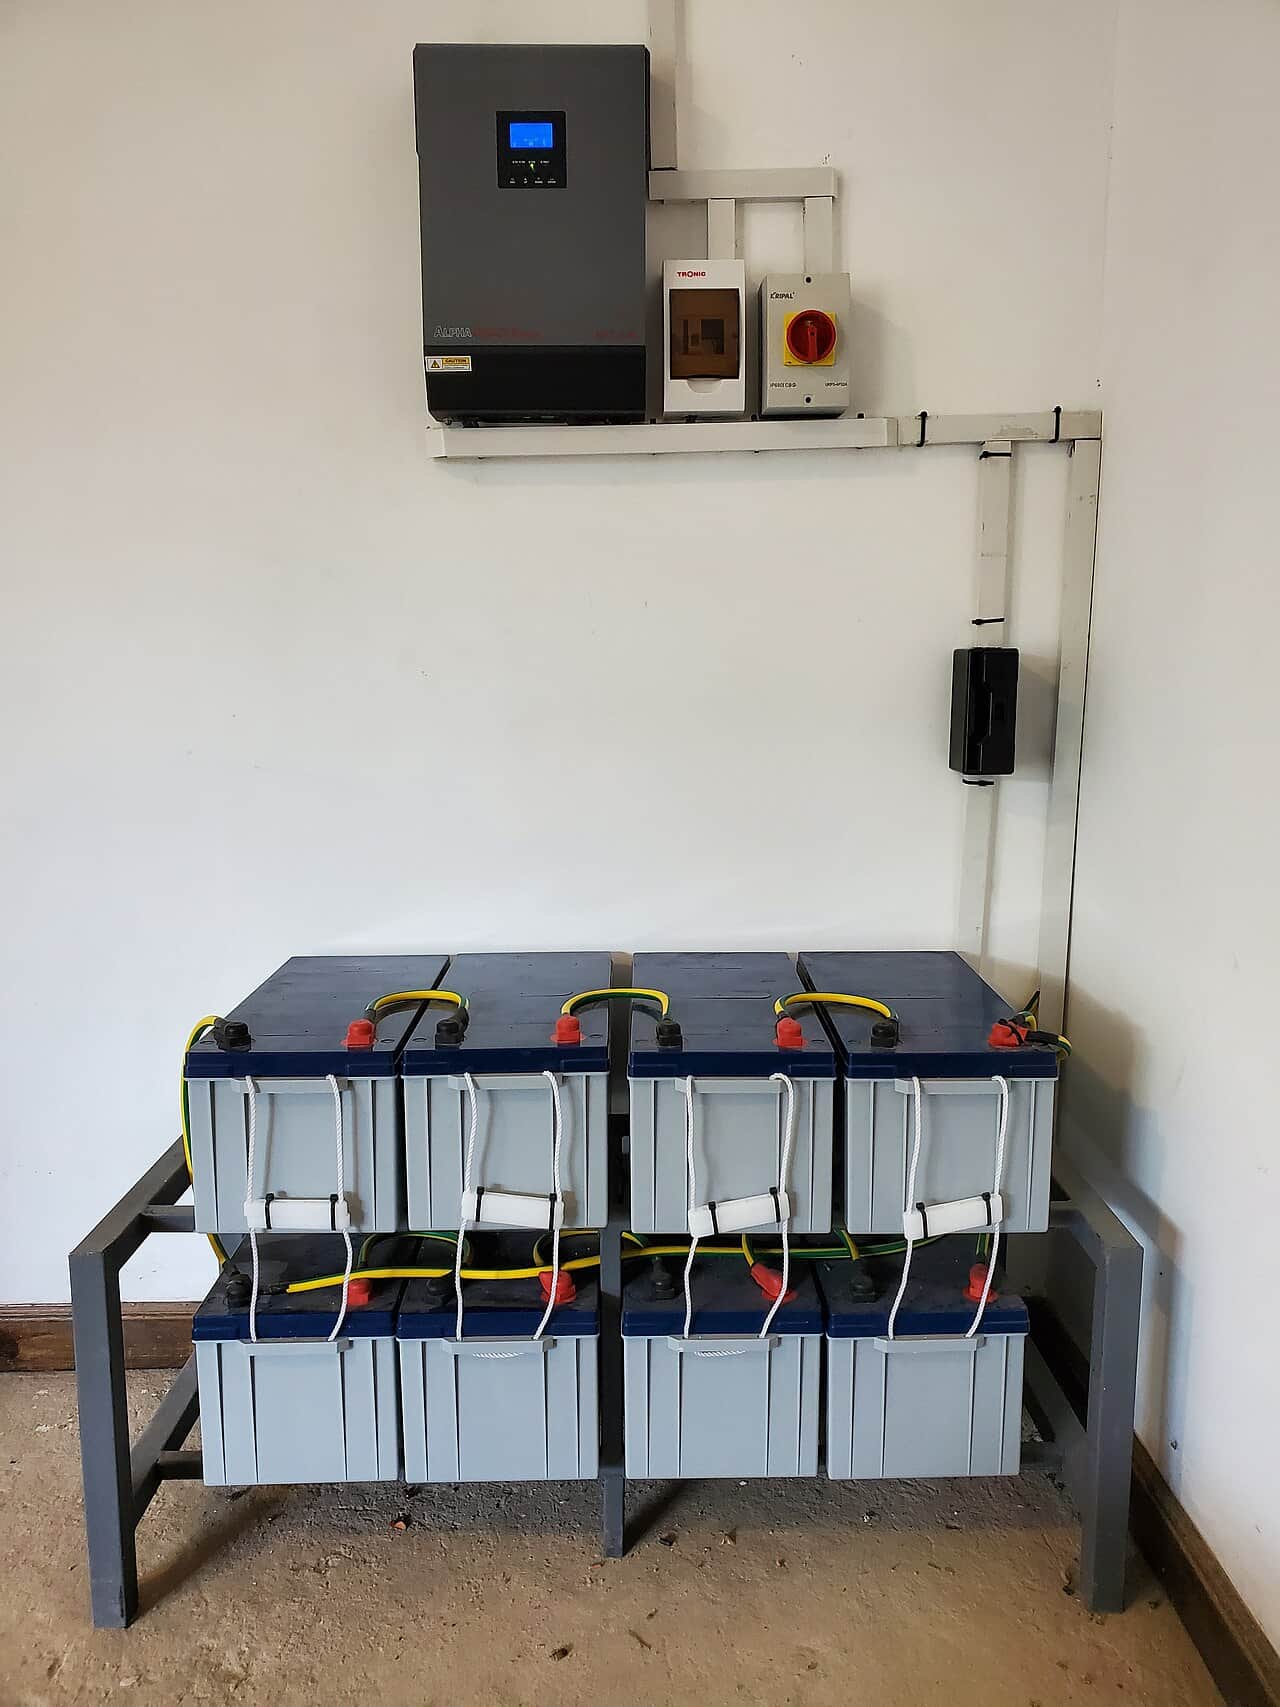 Battery bank and inverter, KenyaPowerAfricaSolar / Wikimedia Commons · CC BY-SA 4.0, cropped · Source
 Solar data analyst at work, KenyaDwalsh3 / Wikimedia Commons · CC BY-SA 4.0, cropped · Source
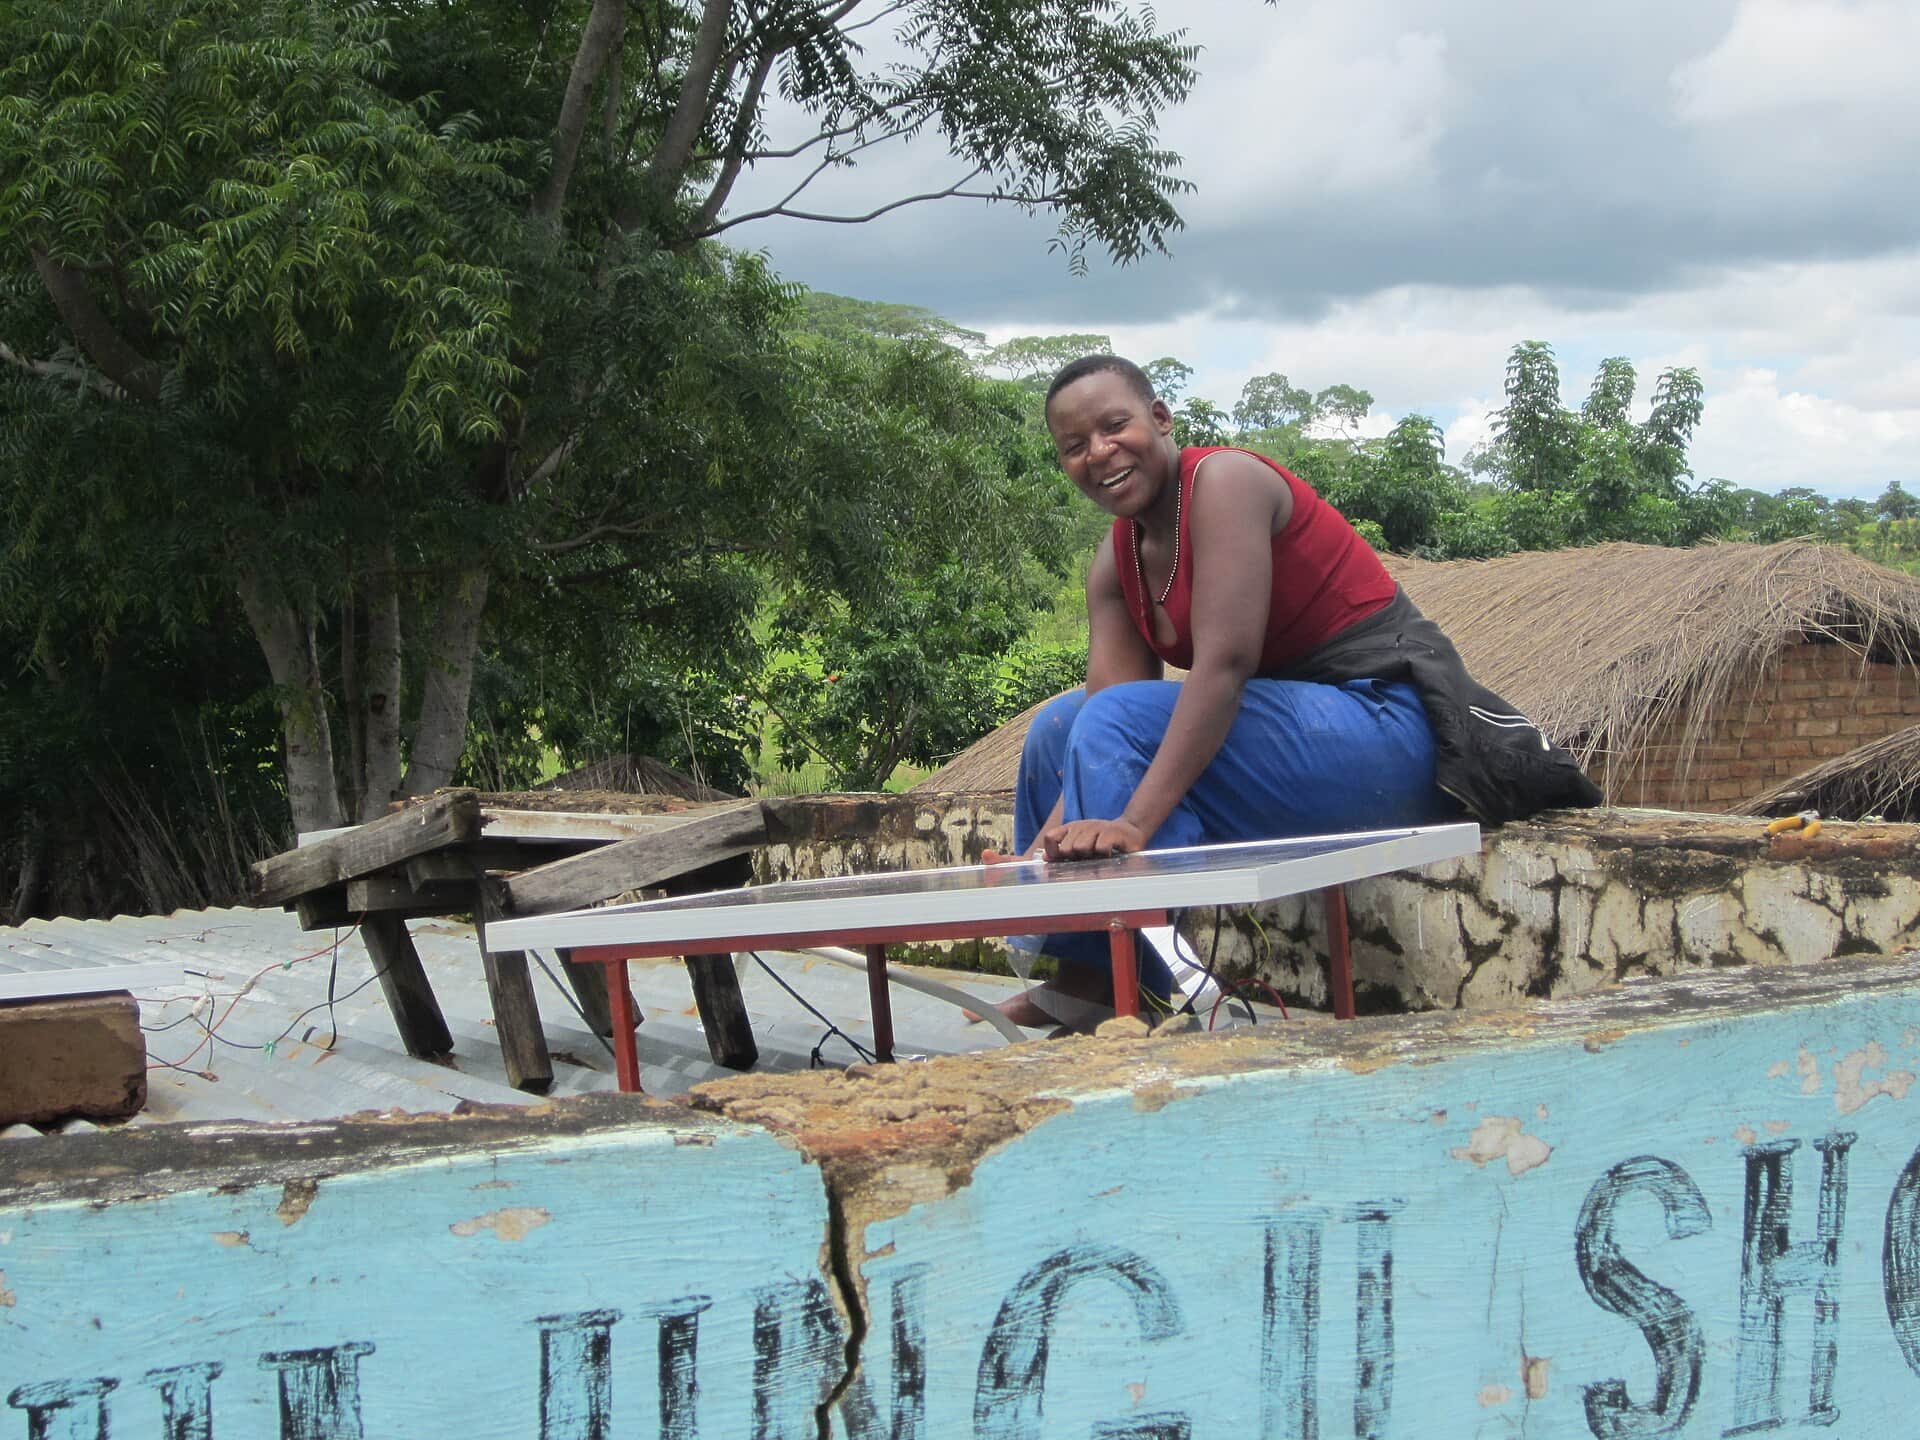 Mounting a solar panel, Masewe, MalawiJonStrand / Wikimedia Commons · CC BY-SA 4.0, cropped · Source
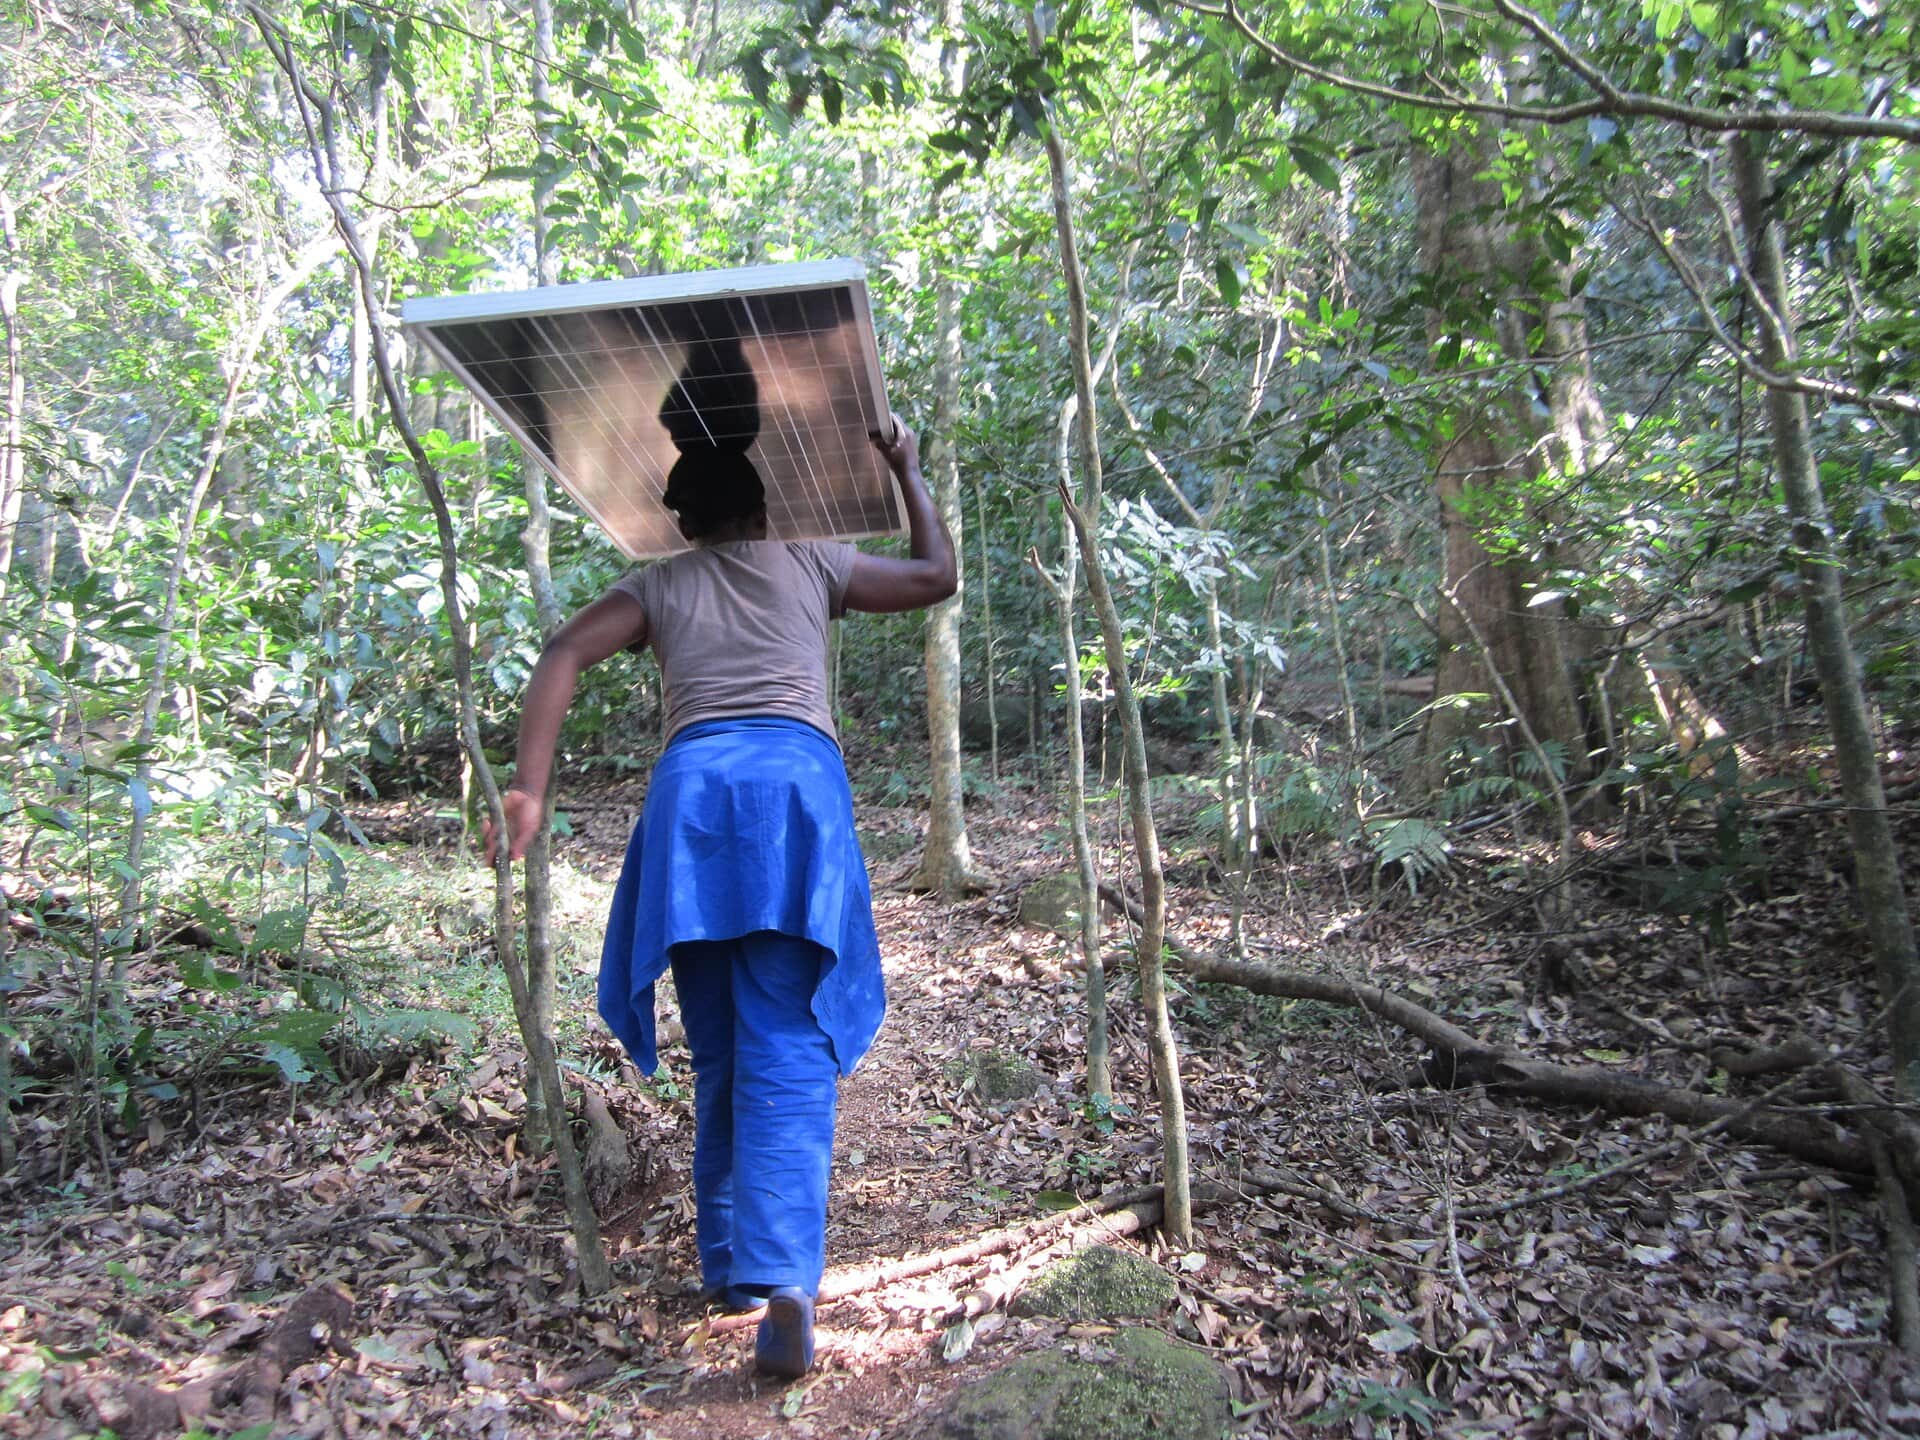 Carrying a solar panel, MalawiJonStrand / Wikimedia Commons · CC BY-SA 4.0, cropped · Source
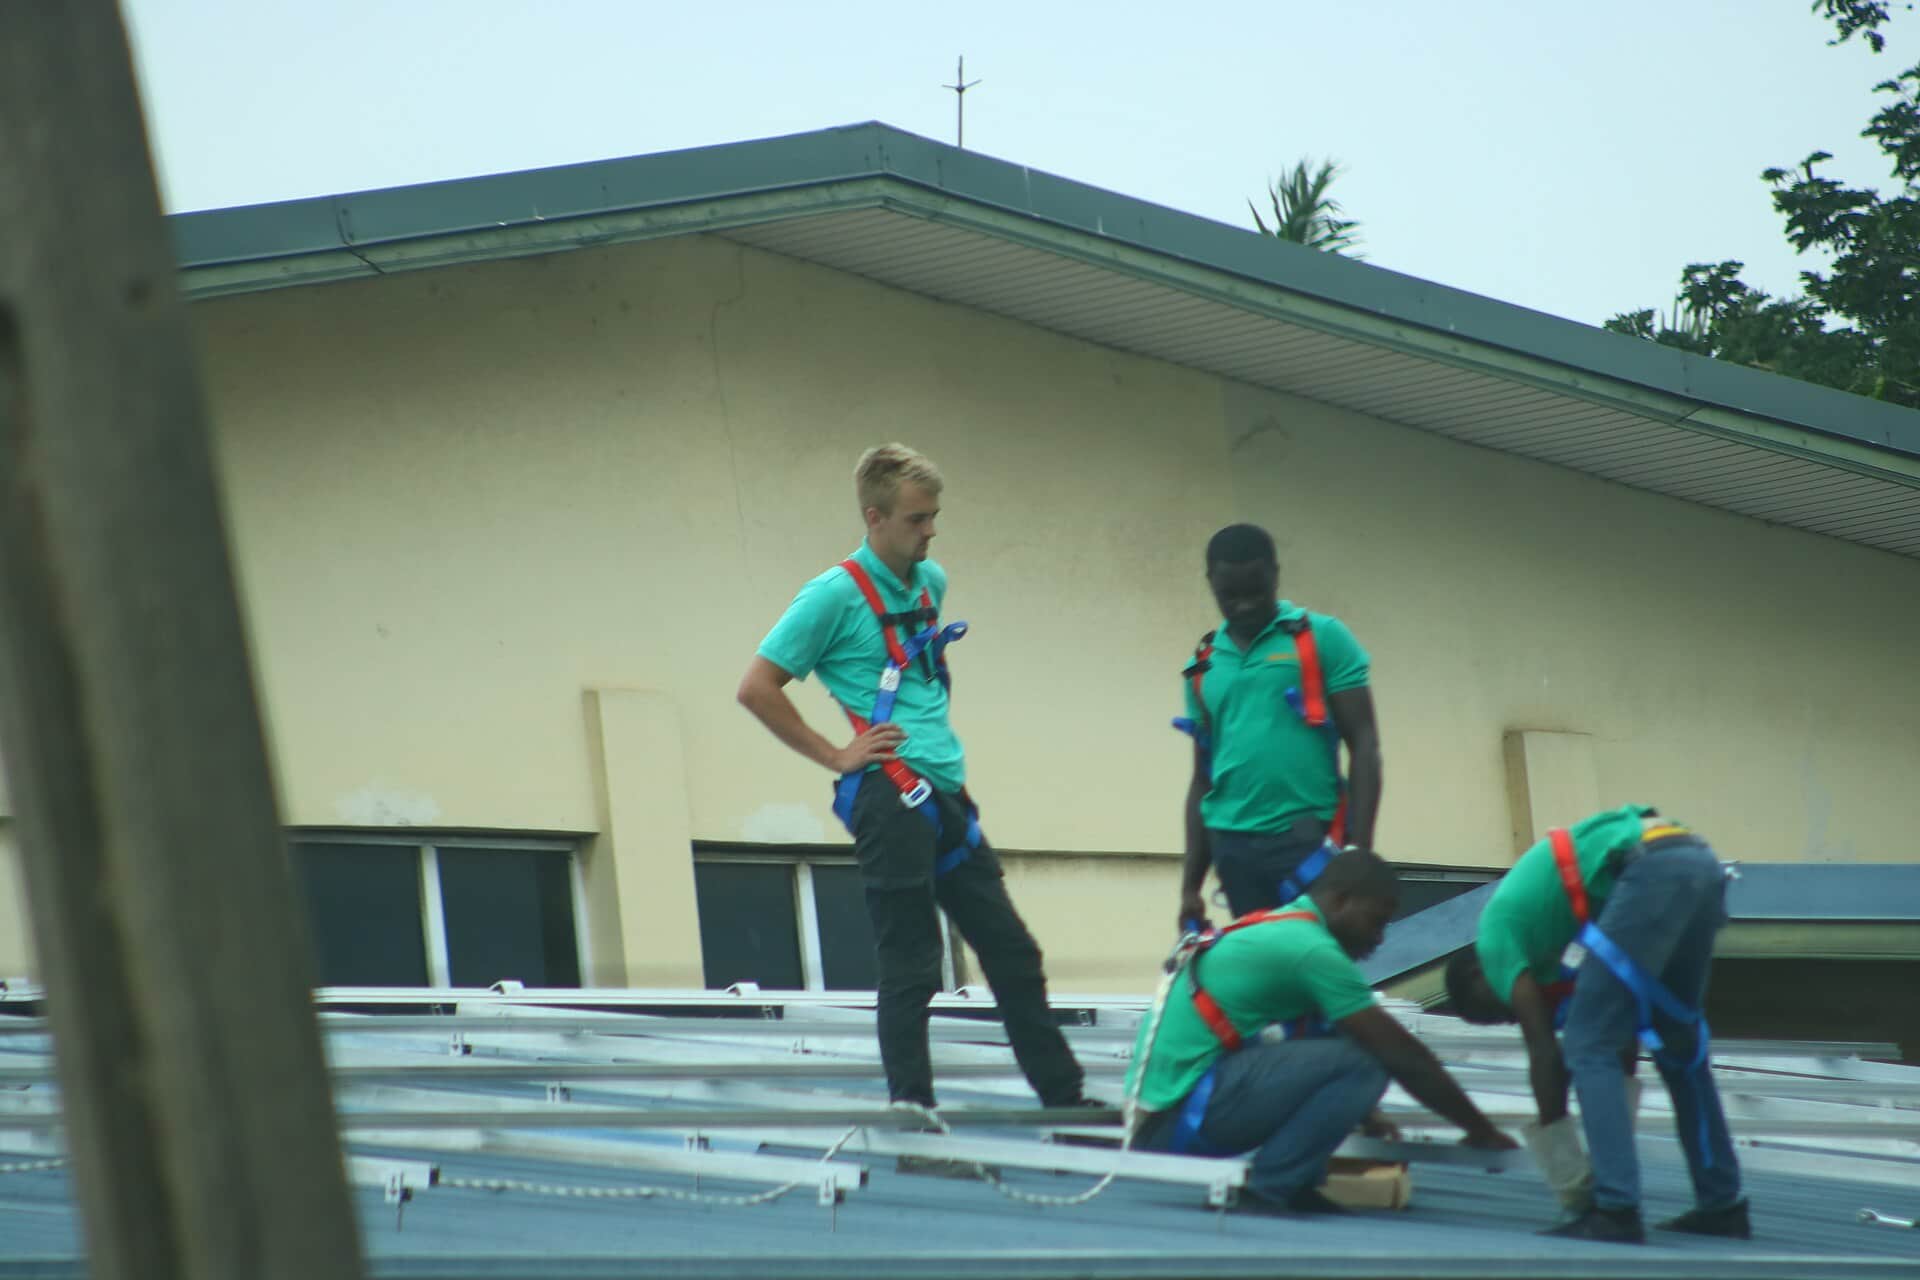 Solar technicians, GhanaSAgbley / Wikimedia Commons · CC BY-SA 4.0, cropped · Source
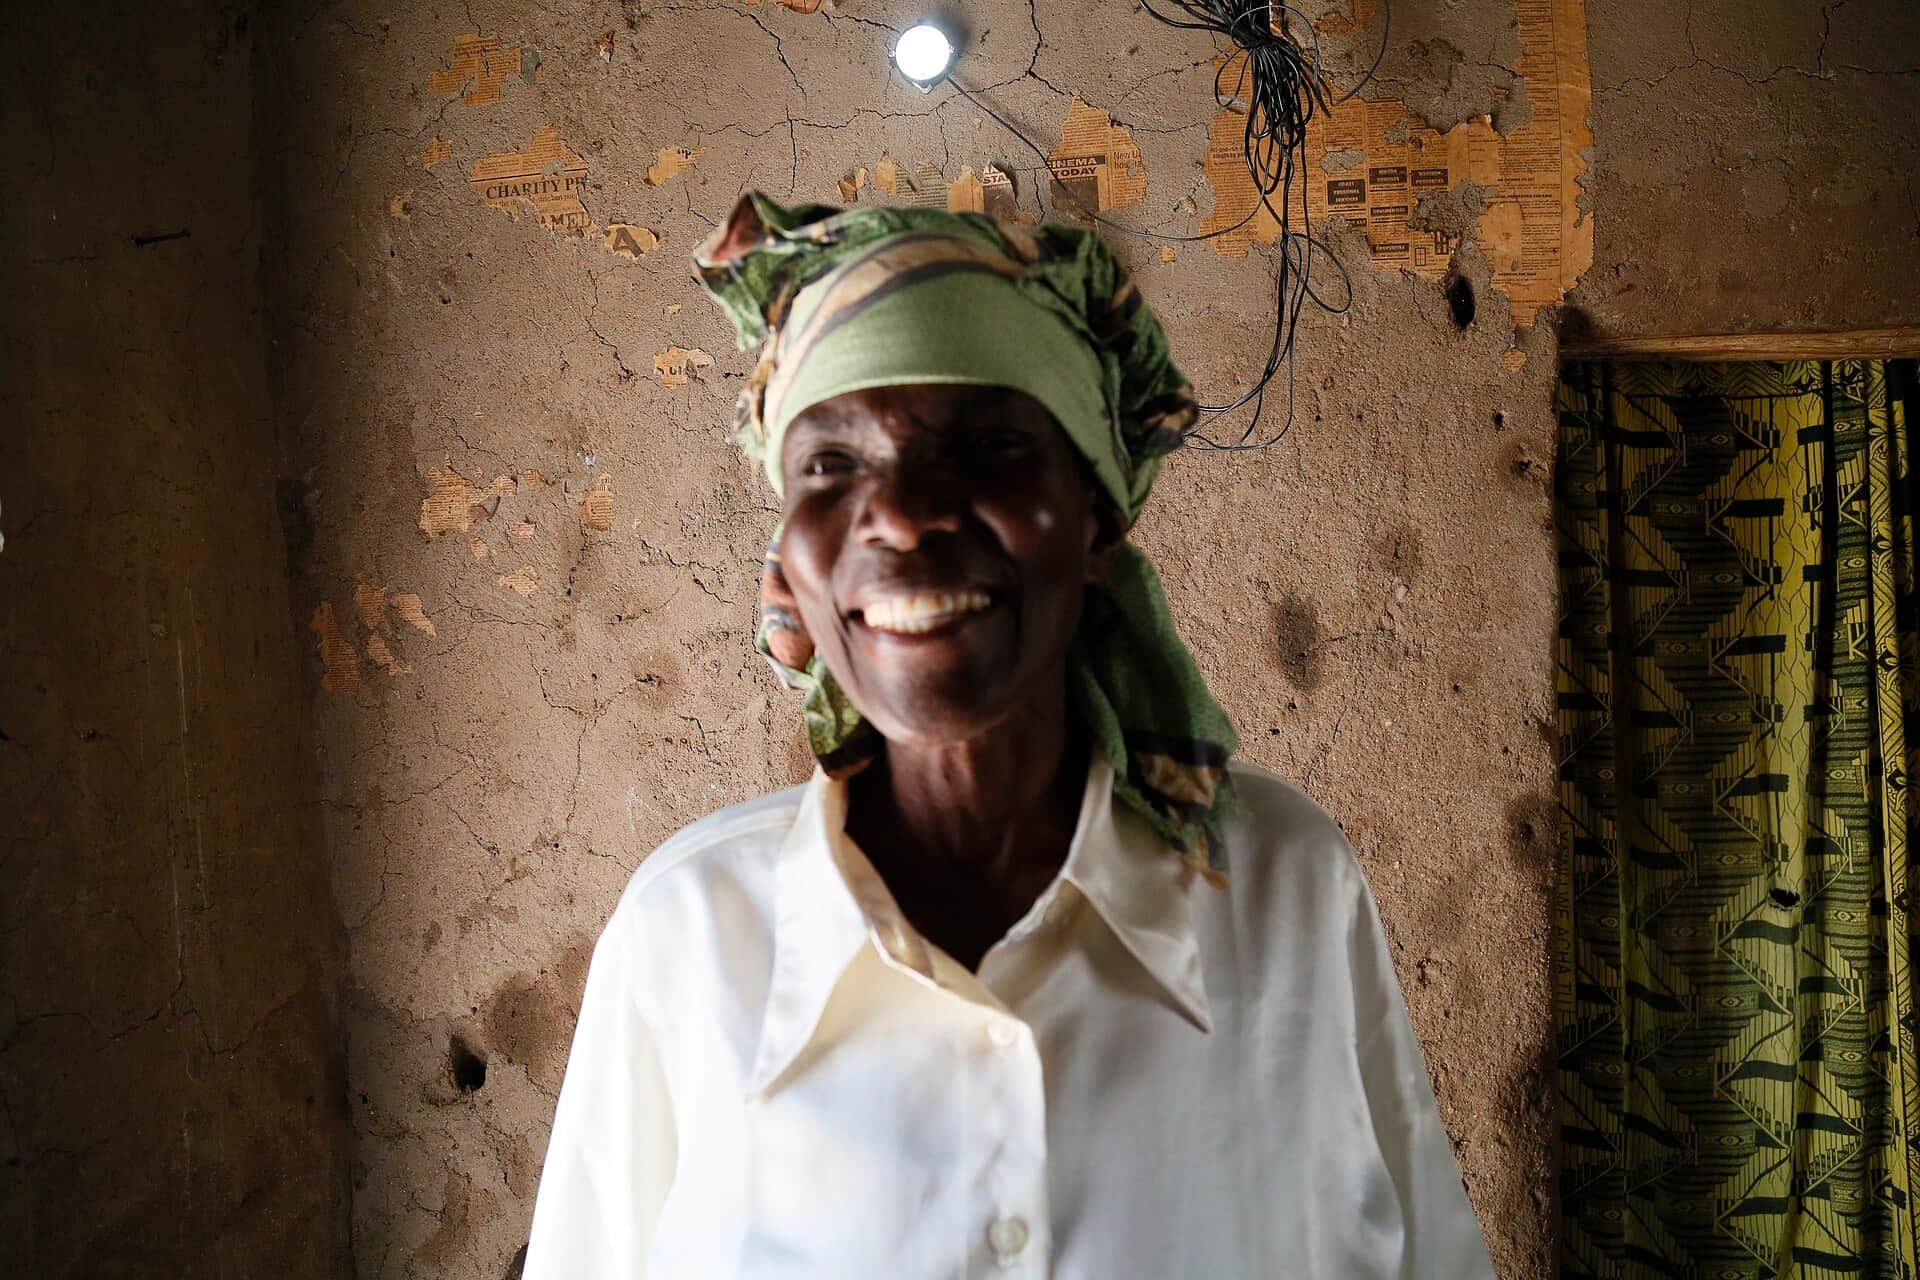 Elizabeth Mukwimba with pay-as-you-go solar, TanzaniaRussell Watkins/DFID / Wikimedia Commons · CC BY 2.0, cropped · Source
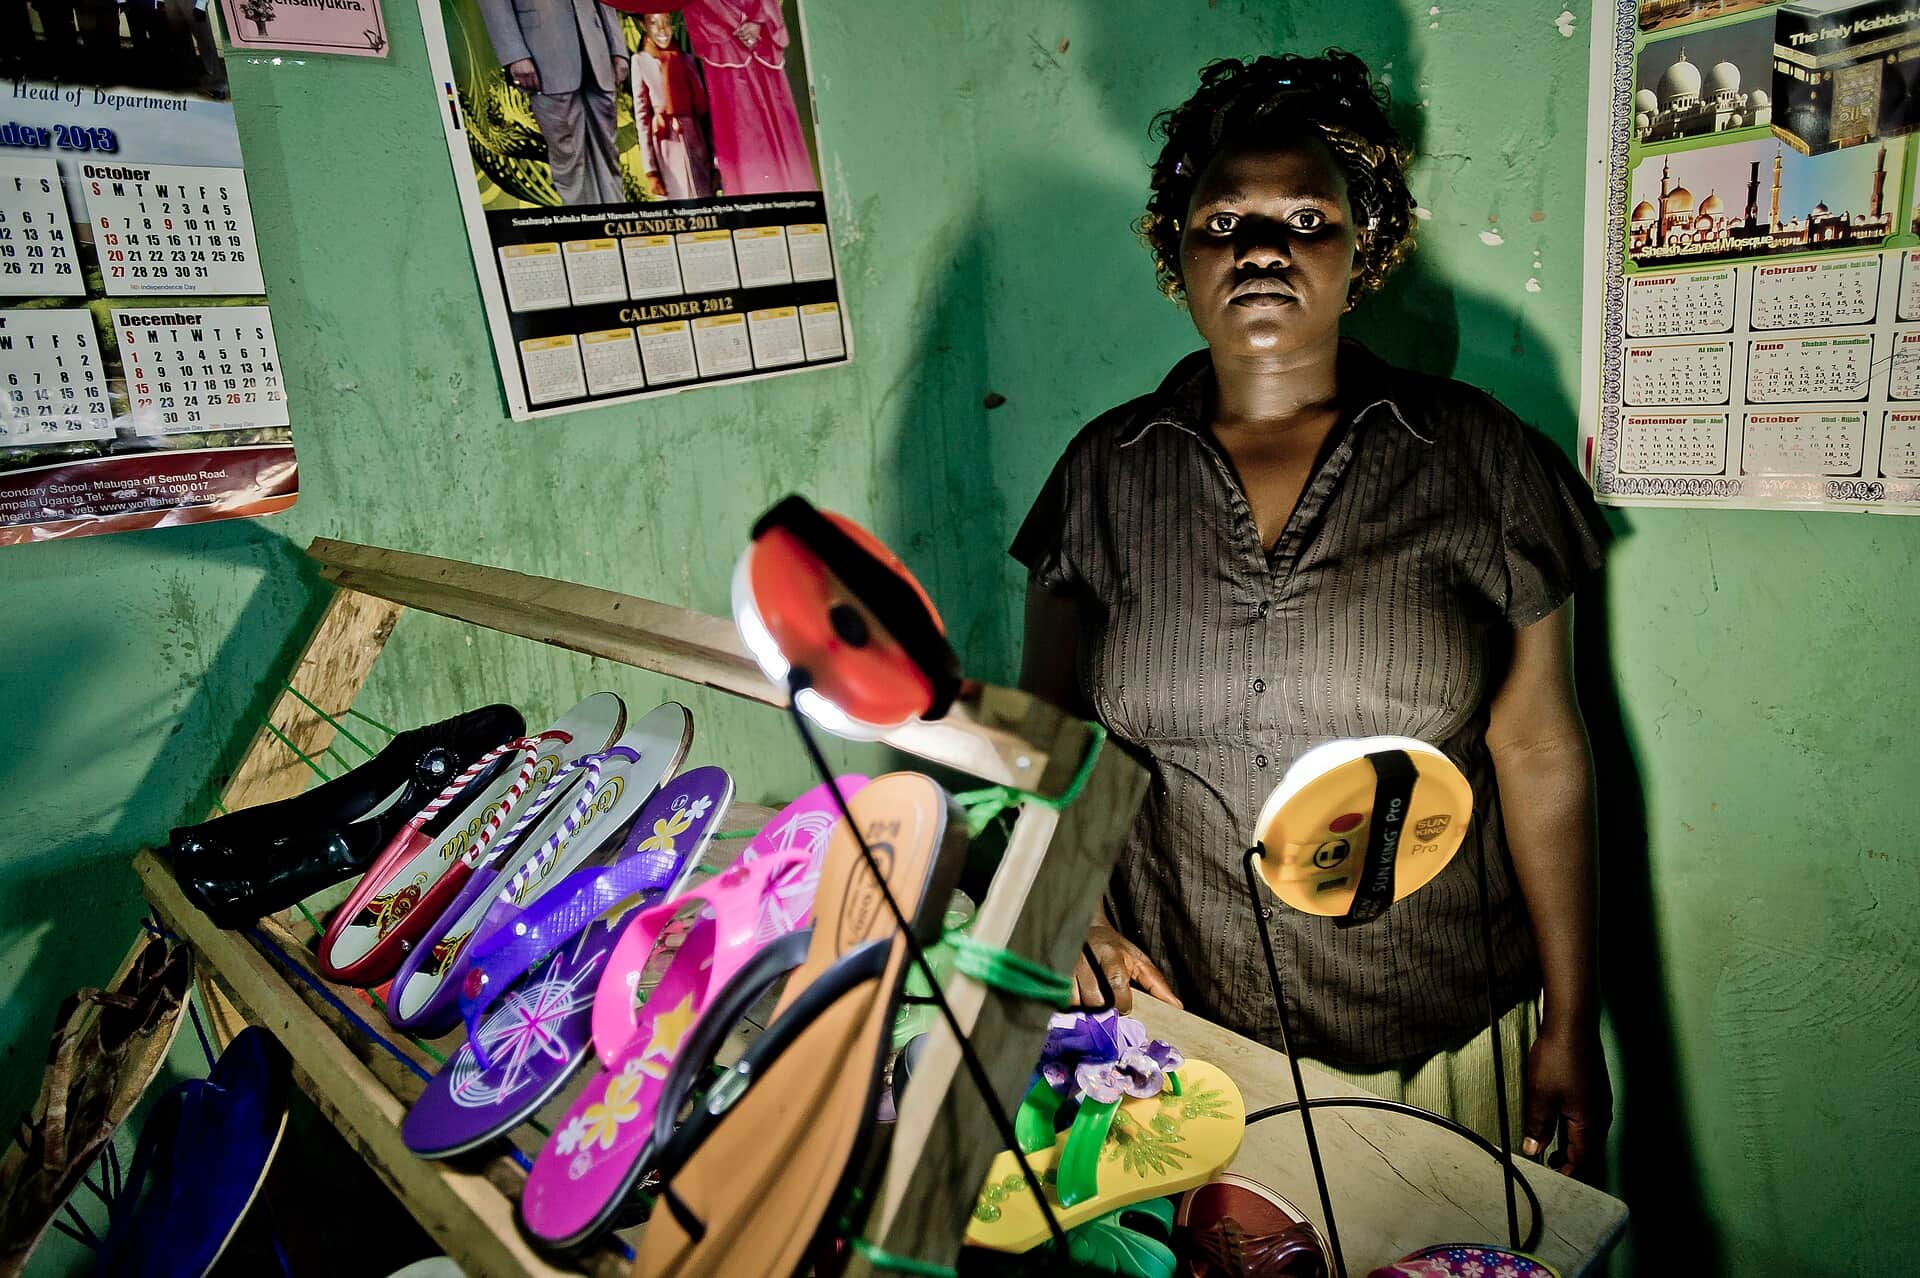 Solar retailer, CleanStart UgandaNasque / Wikimedia Commons · CC BY-SA 4.0, cropped · Source
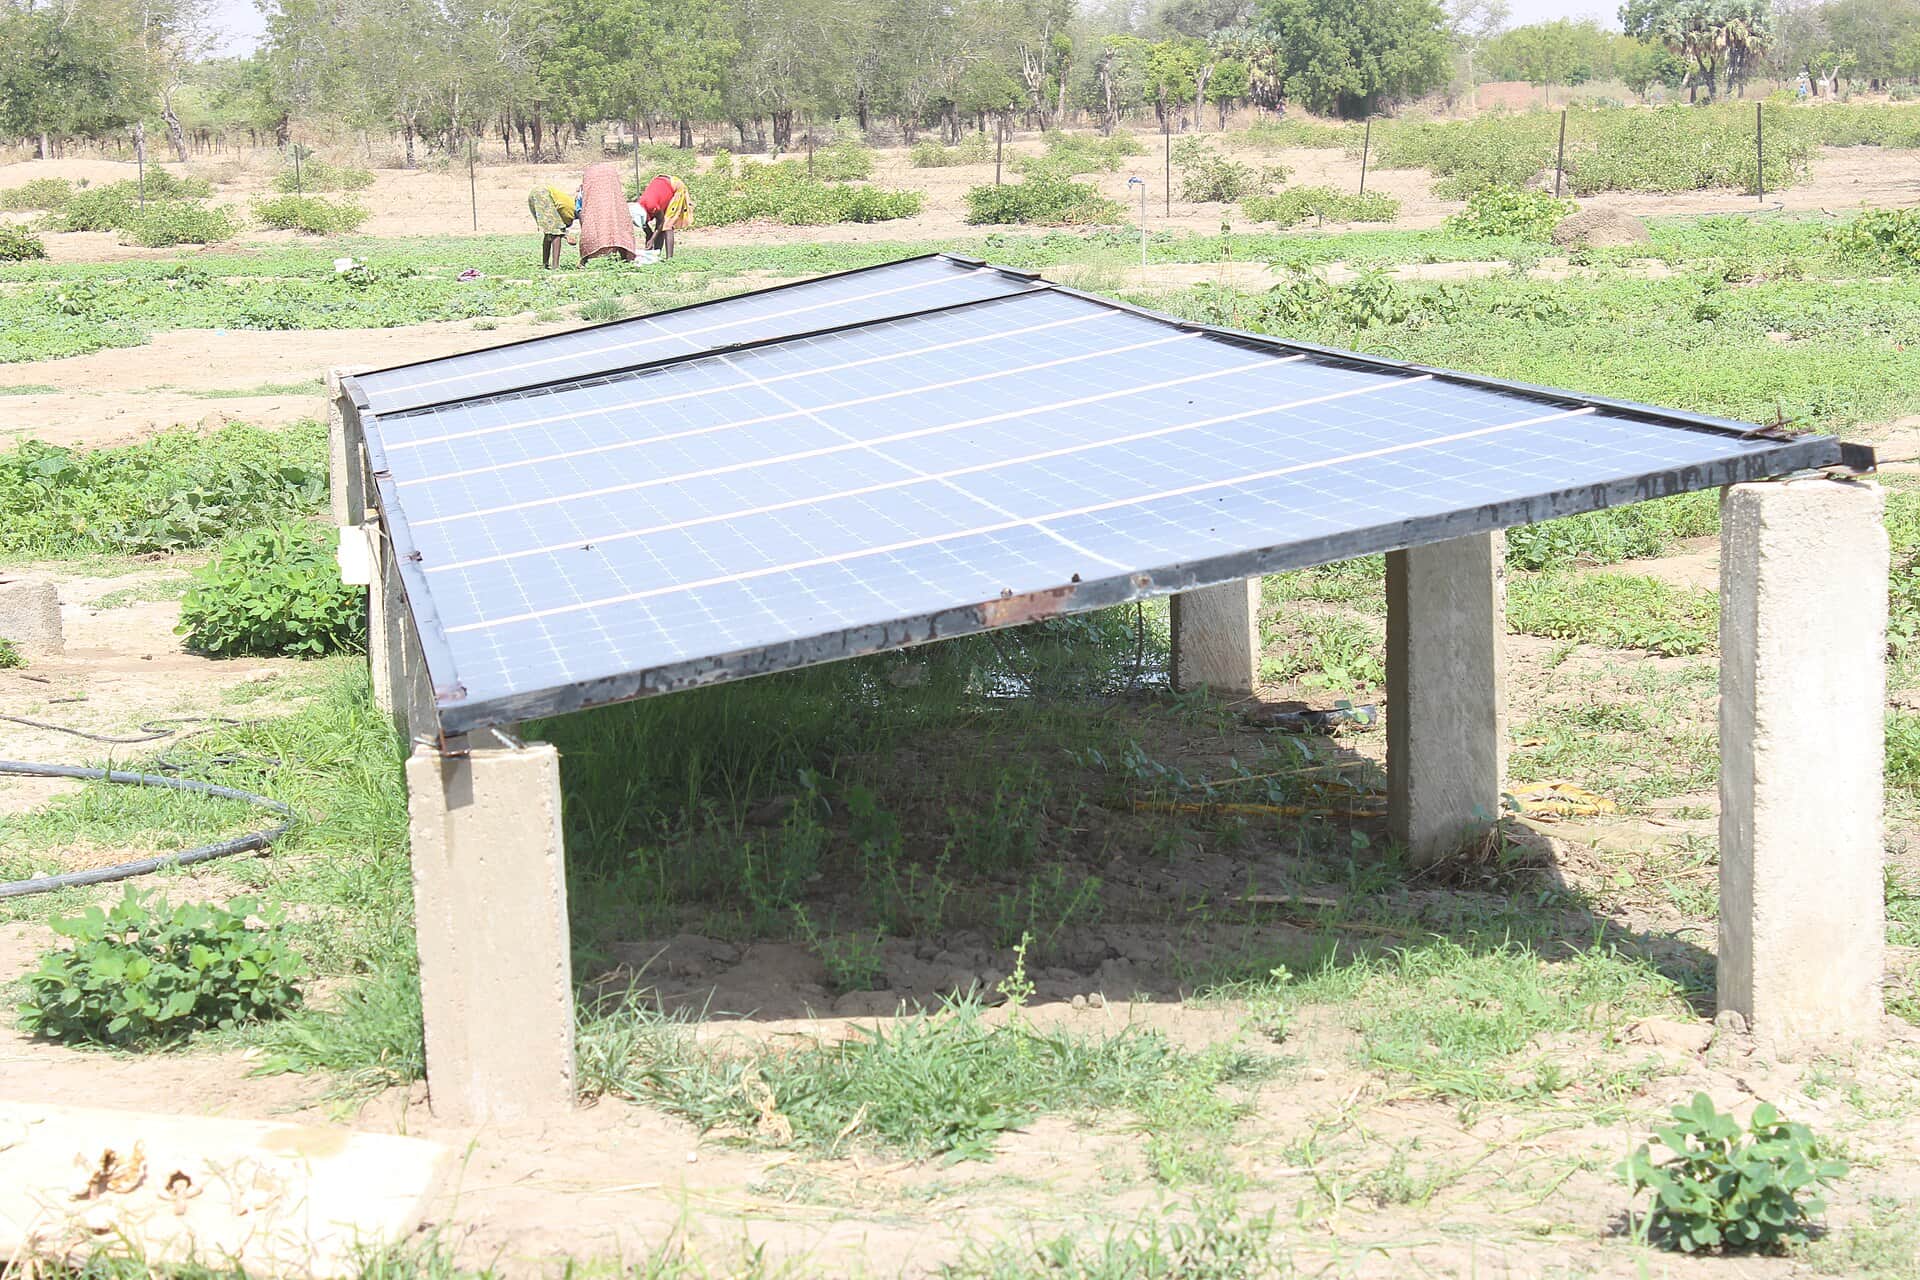 Solar irrigation, Far North Region, CameroonHamidou Kaou / Wikimedia Commons · CC0 · Source
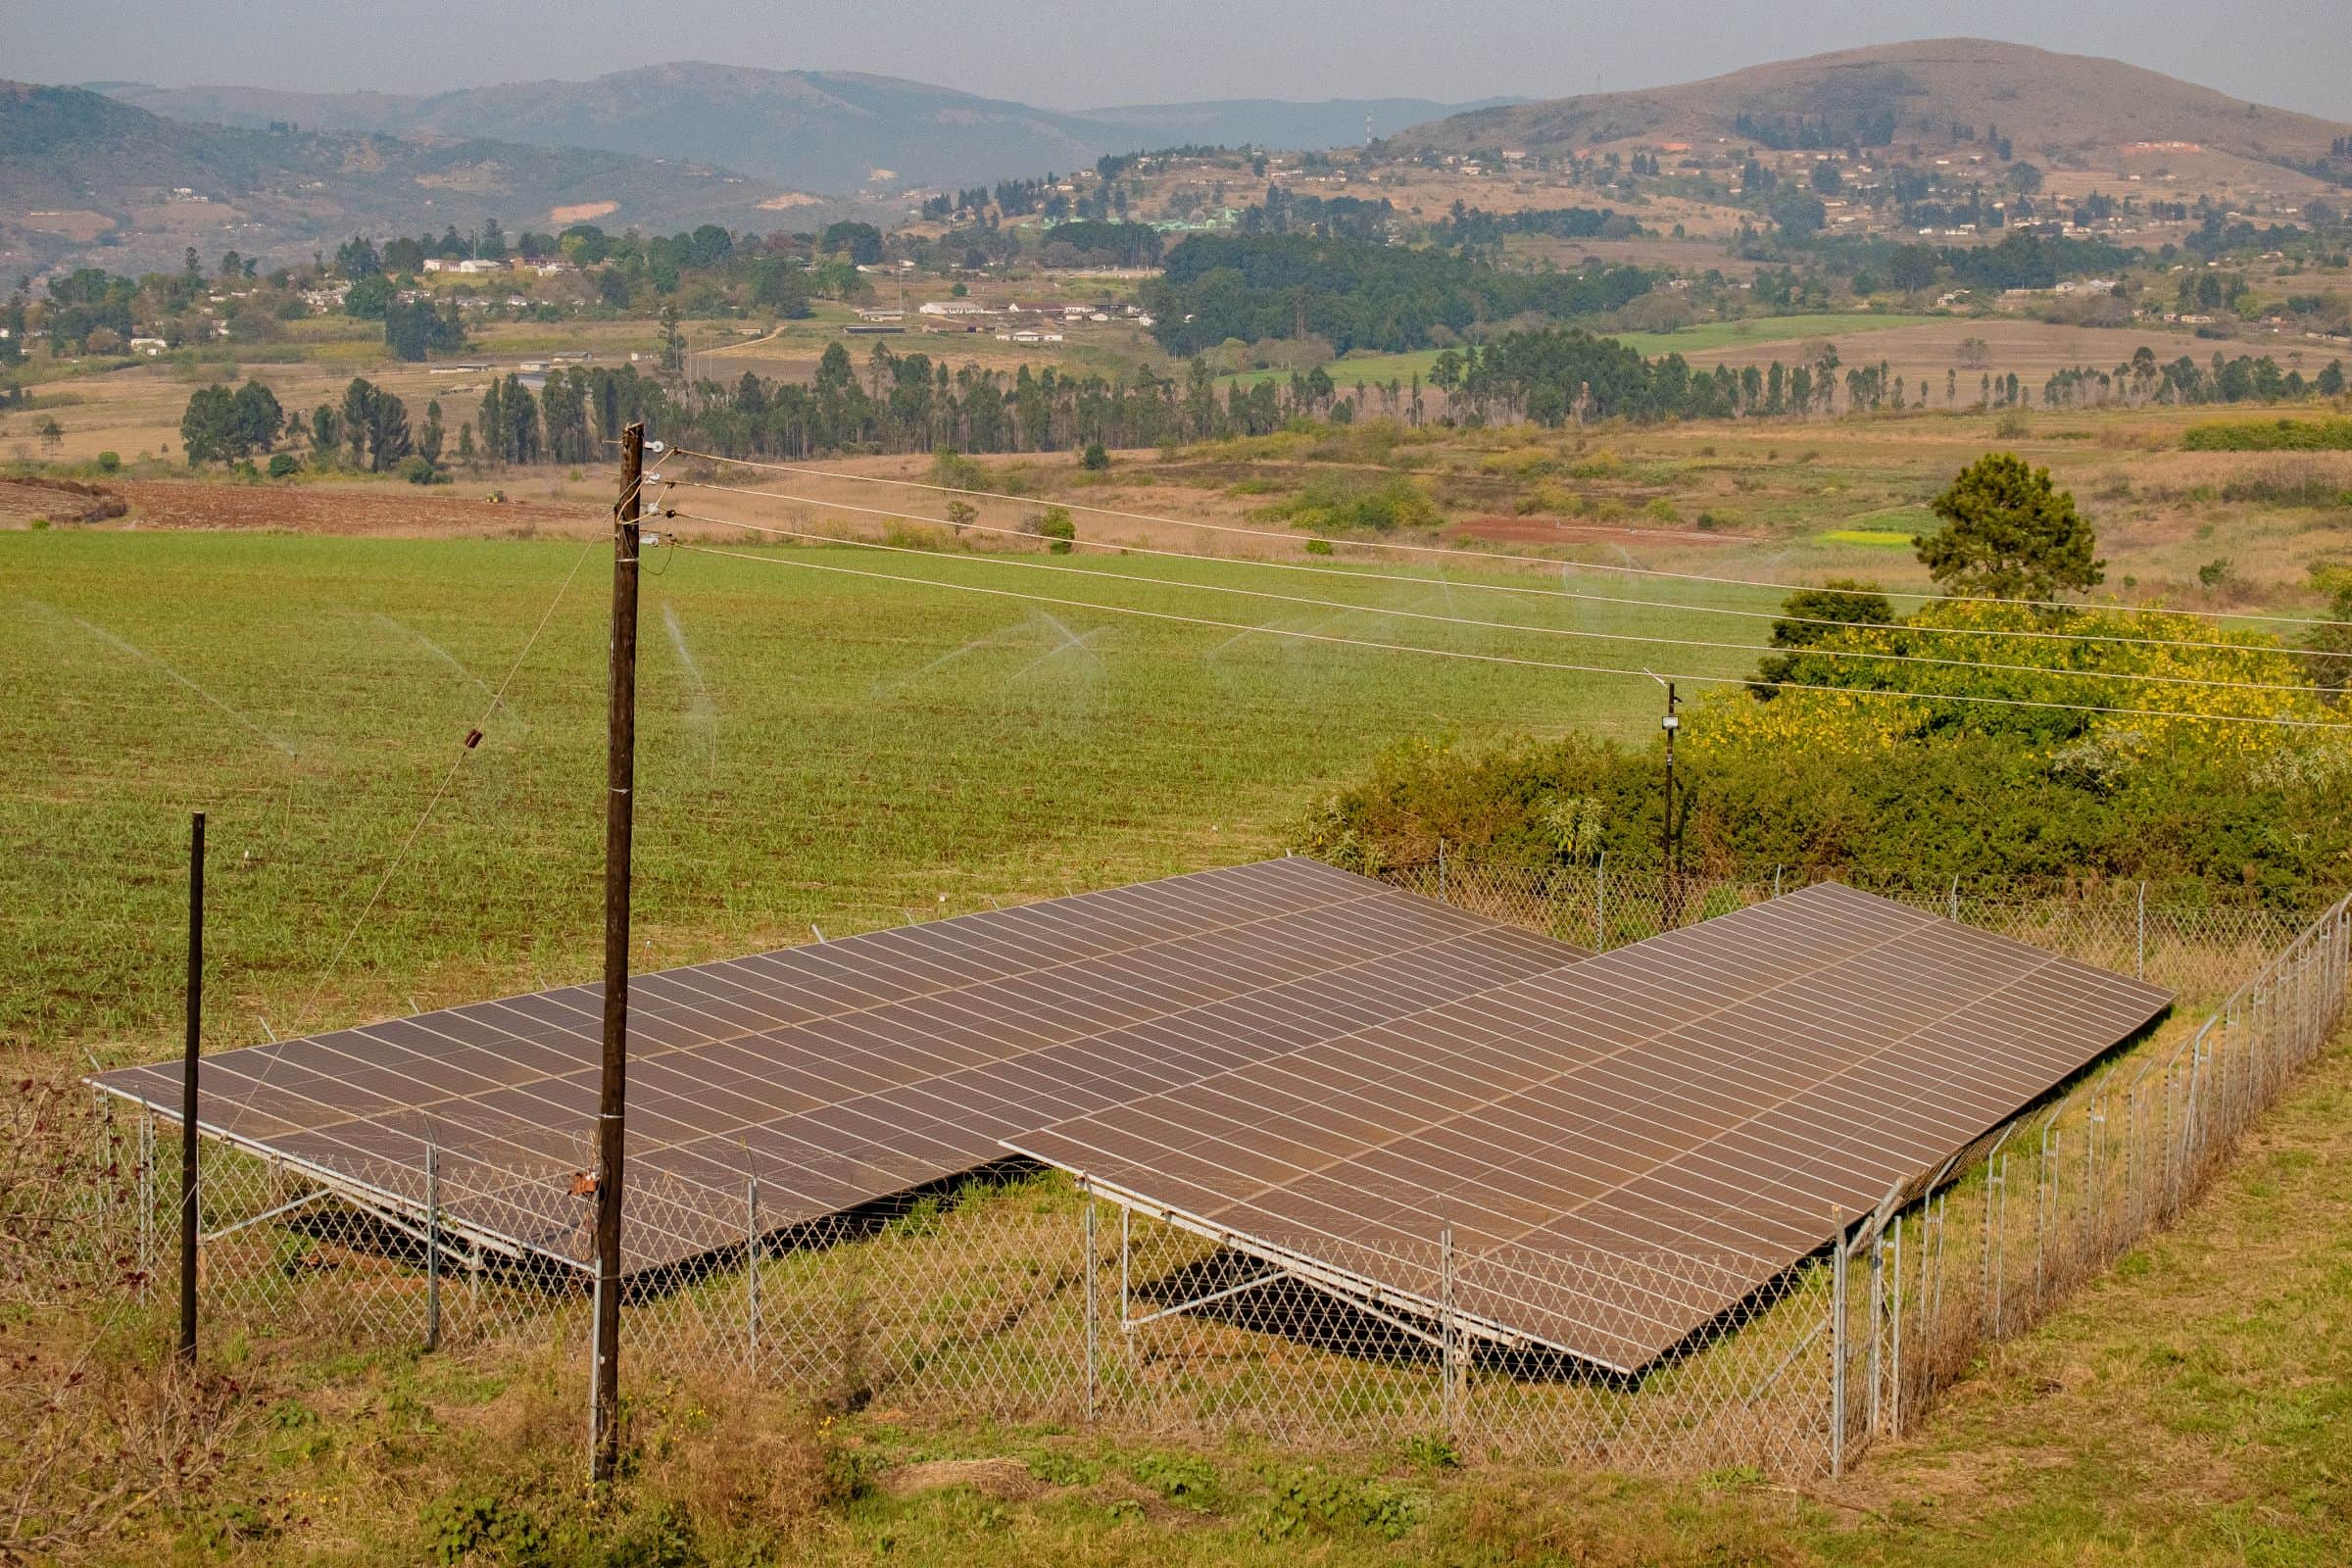 Farm solar near Manzini, EswatiniKhaya Motsa / Pexels · Pexels Licence · Source
Map: Natural Earth 1:50m admin-0 boundaries (public domain).